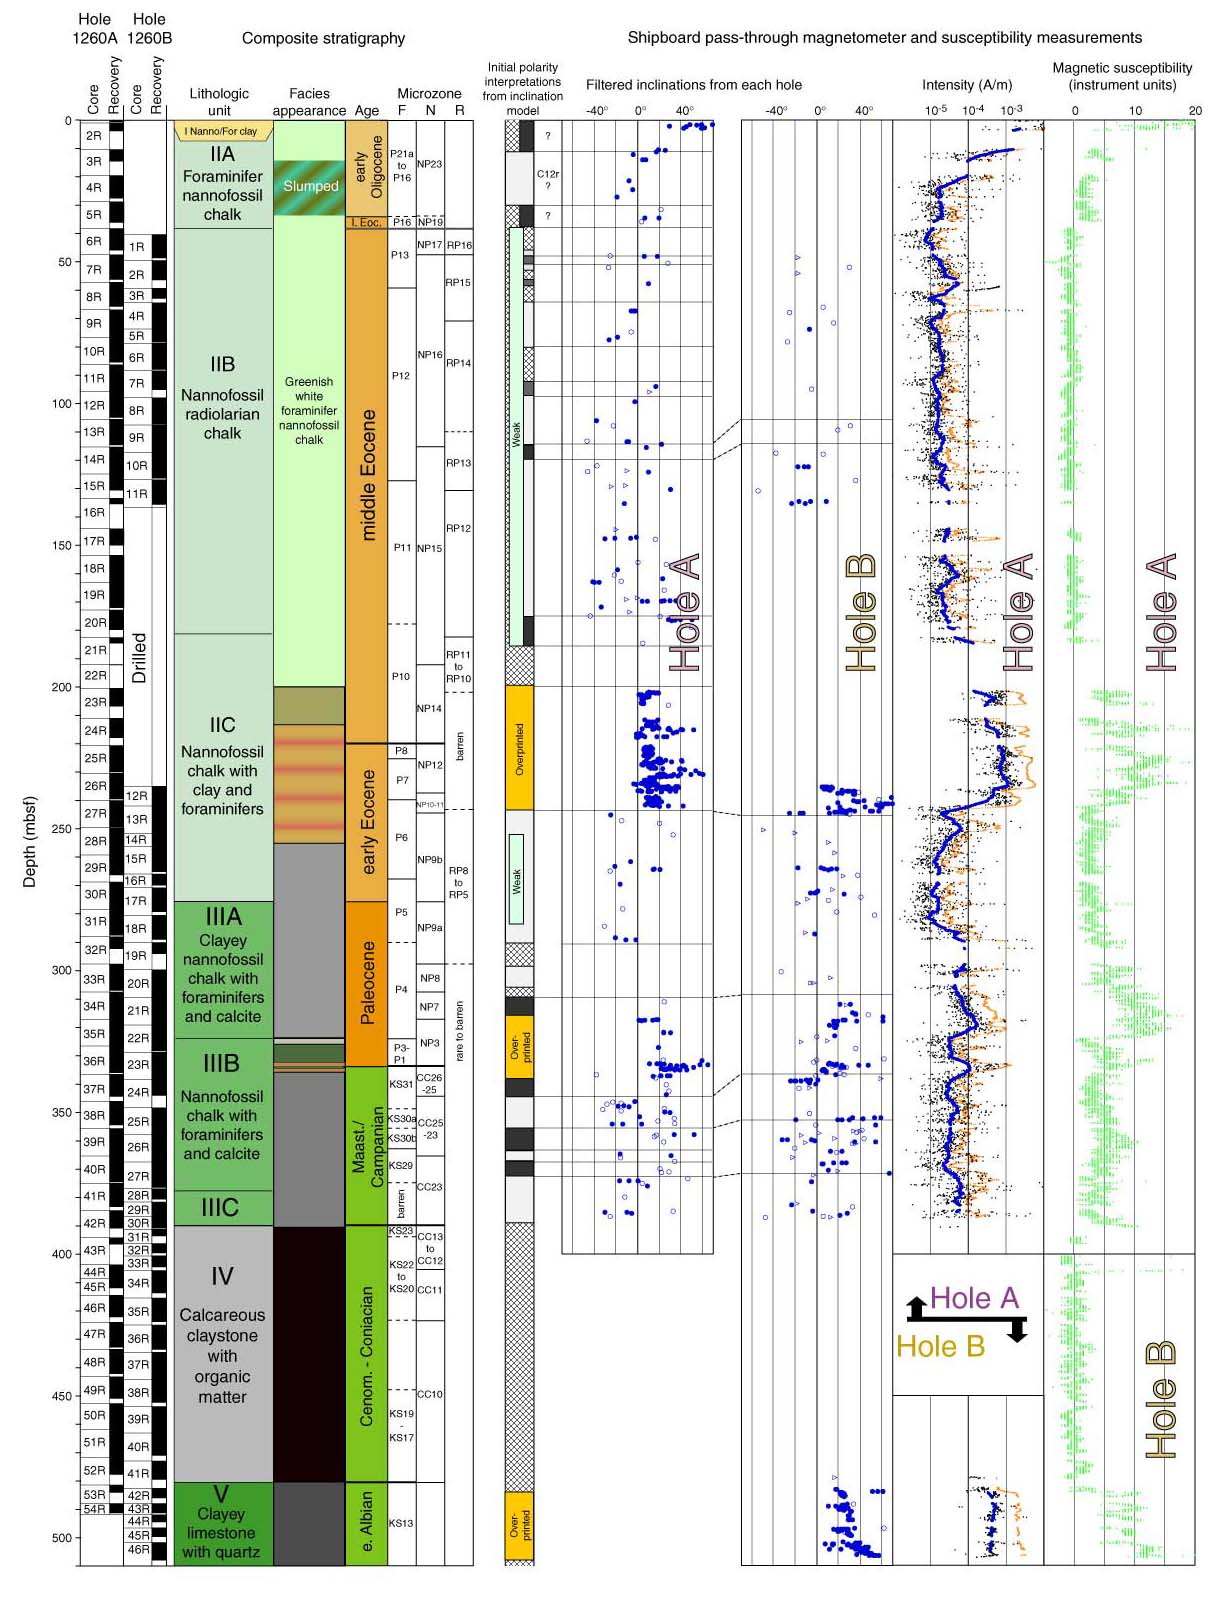
Figure F11. Shipboard paleomagnetic data and initial interpretations of inclination clusters in the Cretaceous–Oligocene of Holes 1260A and 1260B. Visual color variations in the sediment succession generally correspond to changes in magnetic properties and are displayed as an exaggerated schematic column to the right of the shipboard lithostratigraphic units. The paleomagnetic data from the holes have been compared using the composite depth offsets, which rarely exceeded a relative displacement of 4 m at this site. Magnetic inclinations are from intact blocks (excluding measurements within 5 cm of the end of each blocks) after 15-mT demagnetization. The inclination data exclude measurements near the background noise limit of the cryogenic magnetometer (~3 x 10⁻⁵ A/m), therefore measurements with intensities <5 x 10⁻⁵ A/m are not considered reliable. In addition, the upper 20 cm of each core that commonly displays spurious high-intensity magnetization or downhole contamination and the upper 5 cm of each section that is influenced by magnetization carried by the blue-colored end cap are excluded. The displayed inclinations are either 3-point running means (closed circles), 2-point means (open circles), or single-level data (open triangles) (from the central portion of blocks between 10 and 15 cm long, or from isolated levels within a larger block in which the adjacent measurements were <5 x 10⁻⁵ A/m). The magnetic intensity column includes NRM (small orange dots = 21-point running mean) and after the 15-mT demagnetization (small black dots, large blue dots = 101-point log-mean average). Magnetic susceptibility obtained using a magnetic susceptibility core logger (MSCL) is shown by green dots in the right most column. Shipboard assignment of polarity zones were based on clusters of magnetic inclinations from intact blocks (to right of polarity zone column), as delimited by the thin lines. Zones of positive inclinations (originally considered to be normal polarity zones) = black or medium gray, if reliability is less certain; negative or mixed inclinations (originally considered to be reversed polarity zones) = white or light gray, if reliability is less certain. Uncertain inclination characteristics or gaps in data coverage = cross hatched. The shipboard interpretations of polarity zones were not always supported by analyses of magnetic characteristics during progressive thermal demagnetization of minicores (Fig. F12). F = foraminifers, N = nannofossils, R = radiolarians. (This figure is available in an oversized format.)