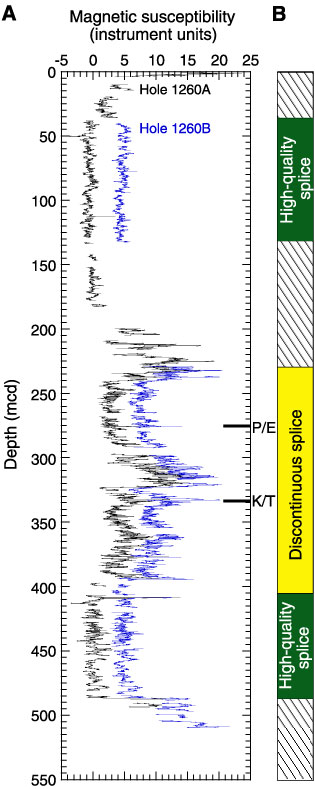
Figure F16. Magnetic susceptibility data plotted along with a qualitative estimate of the confidence of the core-to-core correlations between holes at Site 1260. A. Magnetic susceptibility data for Holes 1260A (black) and 1260B (blue). The composite data from Hole 1260B are offset by a constant (5 units) for illustration purposes. All data sets are smoothed with a 9-point Gaussian filter. B. Green indicates intervals with definitive hole-to-hole correlations and a high-quality splice (i.e., most core gaps spanned). Yellow indicates intervals where good core-to-core correlations could be made (i.e., a one-to-one match of signals between holes) but definitive depth positions could not be established because core gaps could not be spanned. The diagonal line pattern indicates intervals where hole-to-hole correlations could not be made (primarily a result of only one hole in that interval). P/E = Paleocene/Eocene boundary, K/T = Cretaceous/Tertiary boundary.