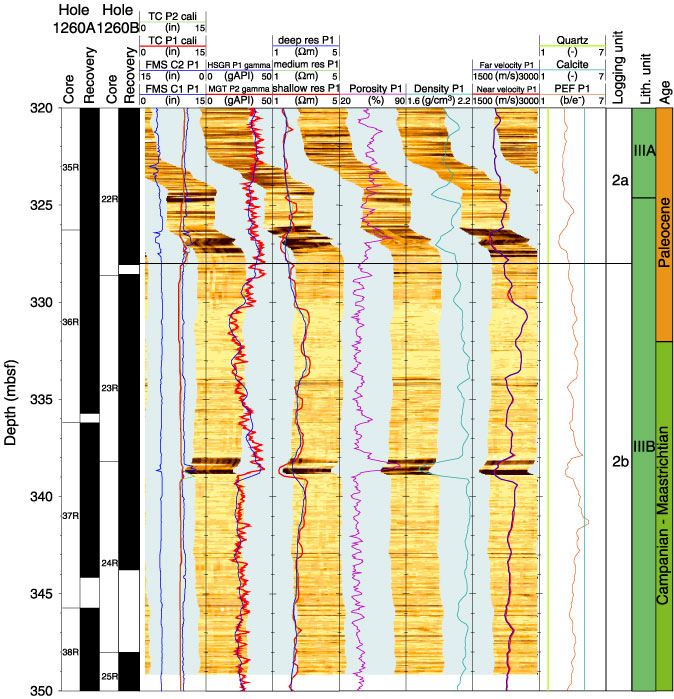
Figure F34. Logging and Formation MicroScanner (FMS) imagery showing the Subunit 2a/2b boundary and the K/T boundary at 338–339 mbsf. (Note the 7-m depth offset between the logging depths and the core lithostratigraphic units.) TC = triple combination, PEF = photoelectric effect.