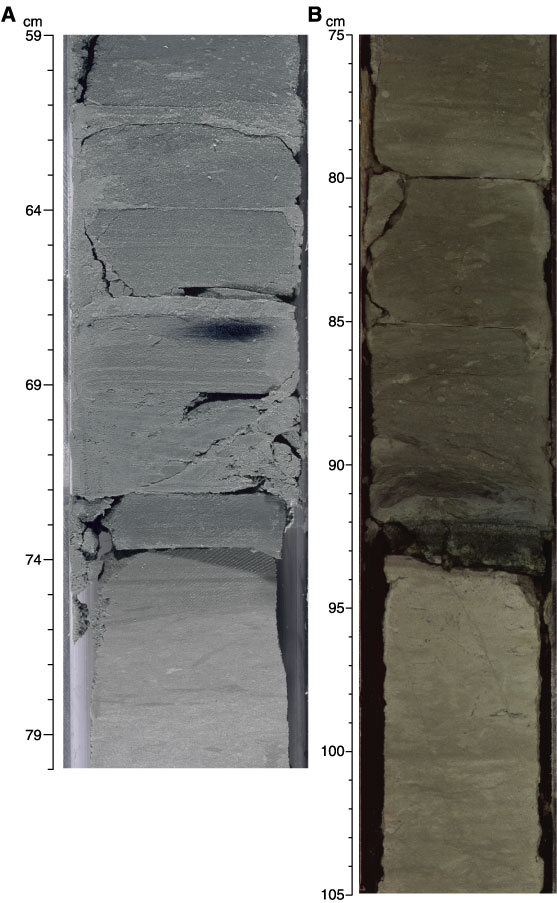
Figure F6. Close-up photographs of lithostratigraphic transitions at the P/E and K/T boundaries. A. P/E boundary with laminated clays and a distinct color change (interval 207-1260A-30R-7, 59–80 cm). B. K/T boundary, with nannofossil claystone below the spherule ejecta layer, which is overlain by greenish gray clay (interval 207-1260A-36R-4, 75–105 cm).