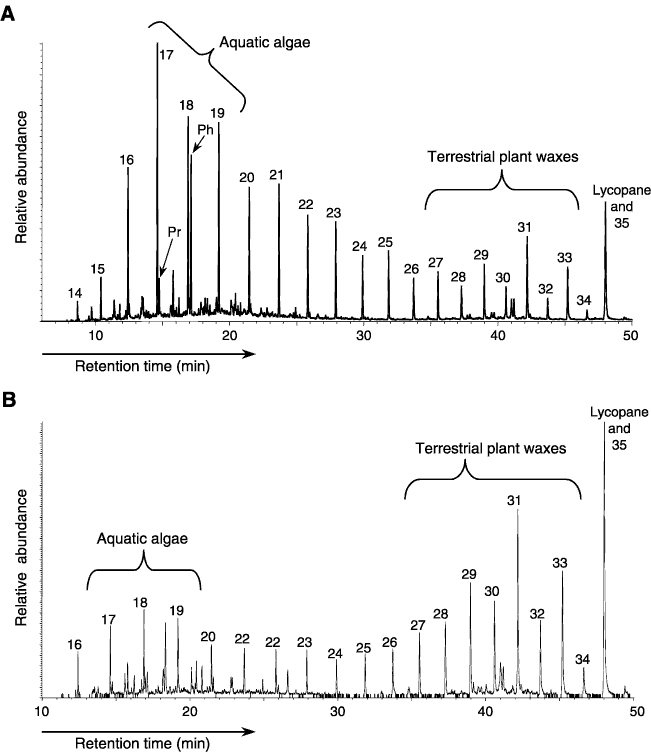
Figure F1. Chromatograms showing n-alkanes and isoprenoids of two representative samples. Numbers by the peaks give the number of carbon atoms in n-alkanes (Pr = pristane, Ph = phytane). A. Ion chromatogram m/z 57 of Sample 207-1258B-55R-1, 49–50 cm. This distribution pattern is typical for a predominantly algal marine signal and represents the most common sample type. B. Ion chromatogram m/z 57 of Sample 207-1257B-22R-1, 44–45 cm. This sample is dominated by high amounts of terrigenous input.


![]()