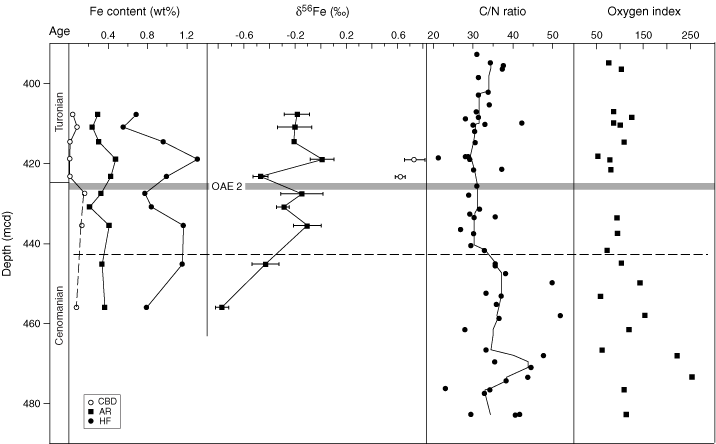
Figure F1. Plot of  56Fe values and the abundance of iron vs. composite depth, compared to organic matter C/N ratios and oxygen index (OI) from Erbacher, Mosher, Malone, et al. (2004). See text for explanation of different iron extraction methods. Error bars on Fe isotope values = 2
 . Gray bar through plot denotes the stratigraphic extent of oceanic anoxic event (OAE) 2 as recognized from the 13C stratigraphy of Erbacher et al. (2005). Horizontal dotted line = level at which organic matter preservation changes as indicated by the shift in average C/N and OI values. CBD = Na citrate-Na bicarbonate-dithionite, AR = aqua regia, HF = hydrofluoric acid.