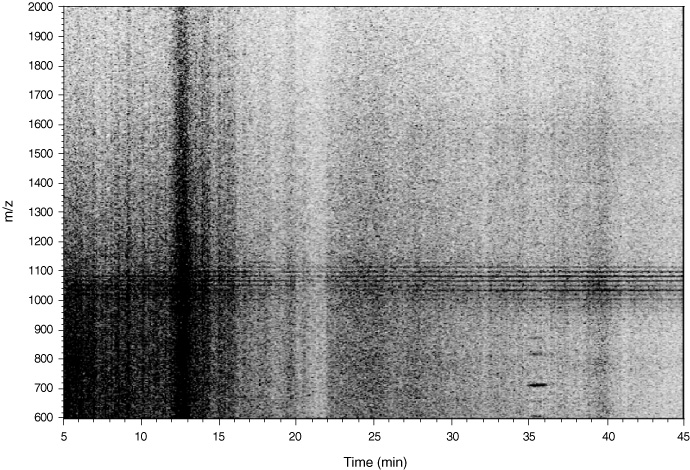
Figure F2. Density map of typical sample (Sample 207-1258B-52R-2, 80–90 cm) in positive ion mode. The vertical lines of darker (e.g., ~13 min) or lighter (~21 min) shading indicate enhancement or suppression of ionization, most likely due to the elution of noncharacterized and chromatographically nonresolved compounds from the HPLC column. The abundance of ions between 1000 and 1100 m/z (mass to charge ratio) resembles column or system bleed.