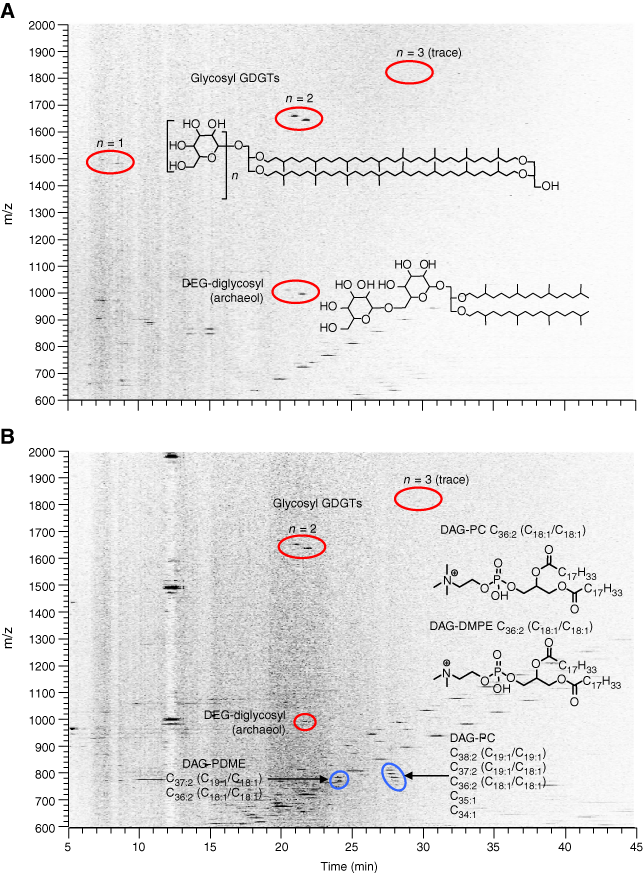
Figure F3. Positive ion density map plots of (A) glycolipid and (B) phospholipid fractions from Sample 207-1257C-5R-2, 130–140 cm; 123.3 mbsf. The two signals corresponding to the diglycosyl GDGT and archaeol species are the regular core lipid and unusual "+14" Da species, see text for discussion. Unmarked signals observed in the density maps were either identified as contaminants or are unidentified compounds showing no characteristics of IPLs. m/z = mass to charge ratio.