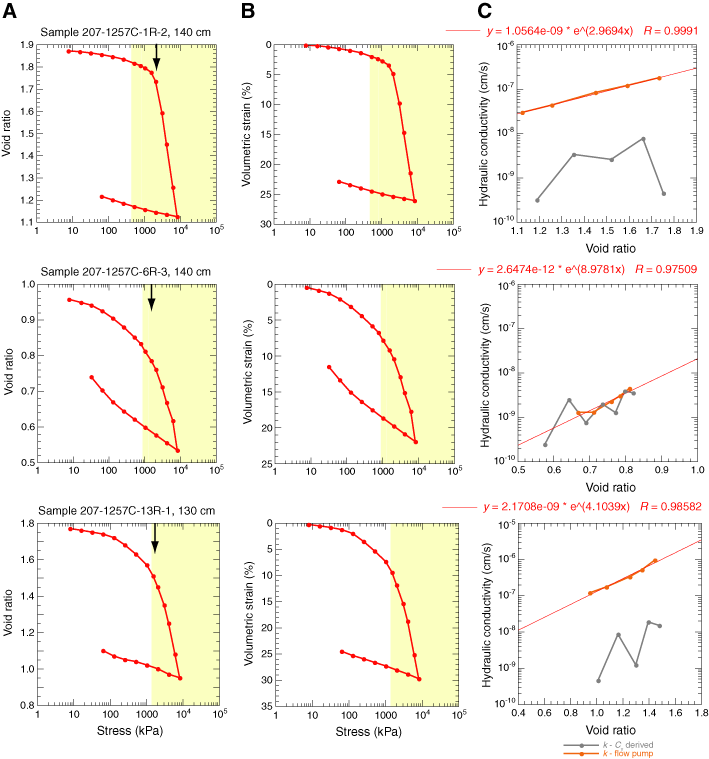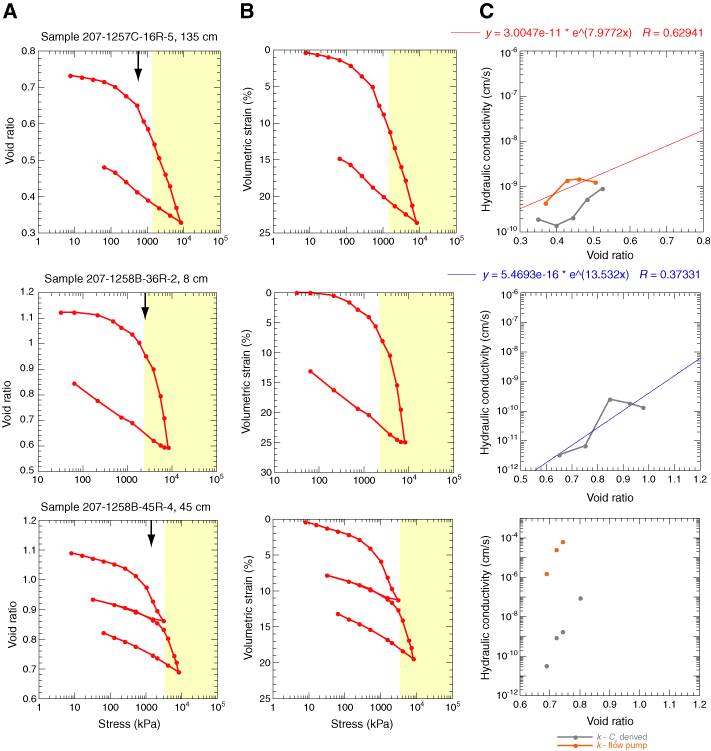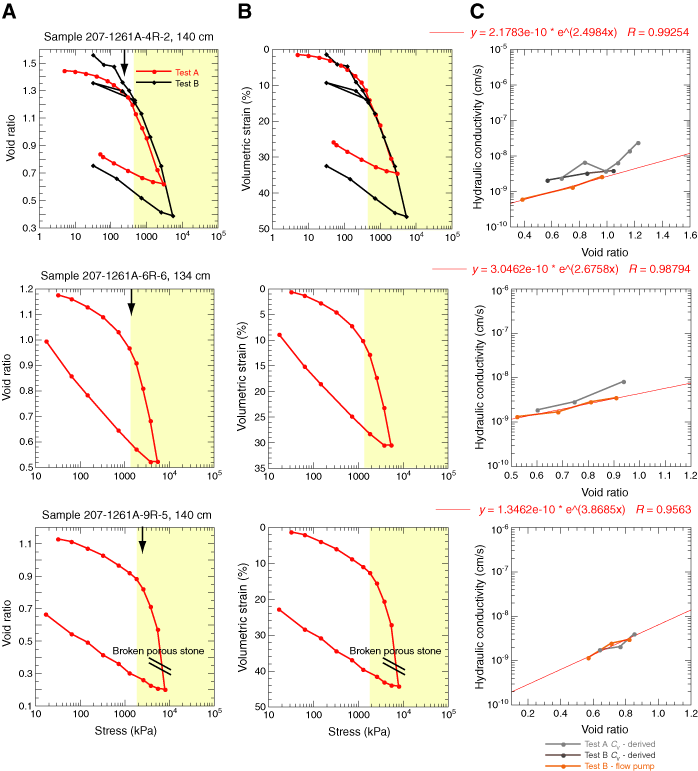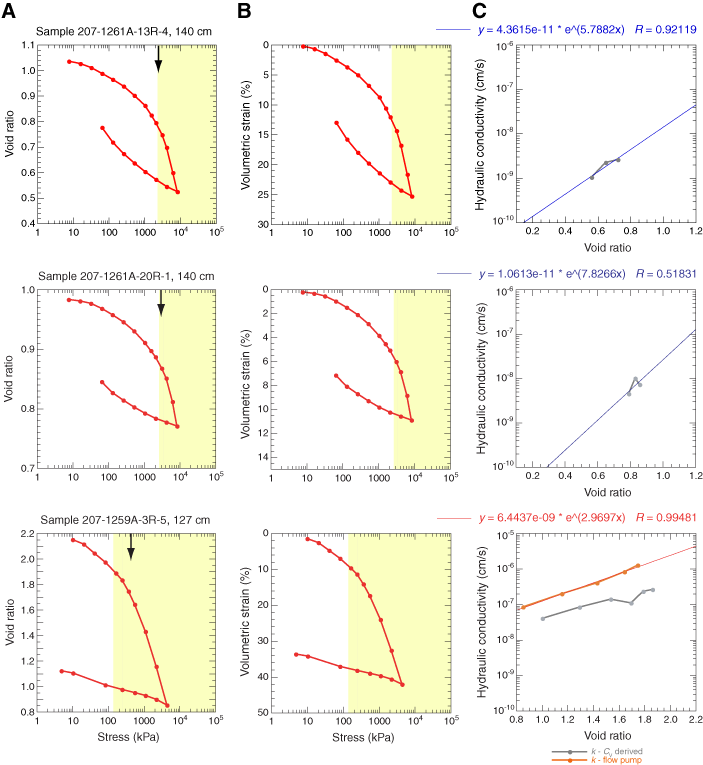
Figure F6. Results from consolidation and permeability tests presented by sample. A. e-log( ´) curves from consolidation tests with the calculated Pc´ identified by a black arrow. Shading represents the region that exceeds the calculated in situ effective stress and corresponds to stresses over which a normally consolidated sample should be proceeding along the virgin compression curve. B. Volumetric strain-log(
 ´). The amount of volumetric strain required to reach Pc´ offers a simple way to evaluate sample quality (Lunne et al., 1999). C. Results from low-gradient flow pump k tests and k derived from time deformation data acquired during consolidation tests. An exponential fit representing the e-log(k) relationship is displayed for each sample; red = measured k, blue = k from Cv during consolidation test.


 ´) curves from consolidation tests with the calculated Pc´ identified by a black arrow. Shading represents the region that exceeds the calculated in situ effective stress and corresponds to stresses over which a normally consolidated sample should be proceeding along the virgin compression curve. B. Volumetric strain-log(
 ´). The amount of volumetric strain required to reach Pc´ offers a simple way to evaluate sample quality (Lunne et al., 1999). C. Results from low-gradient flow pump k tests and k derived from time deformation data acquired during consolidation tests. An exponential fit representing the e-log(k) relationship is displayed for each sample; red = measured k, blue = k from Cv during consolidation test.


![]()