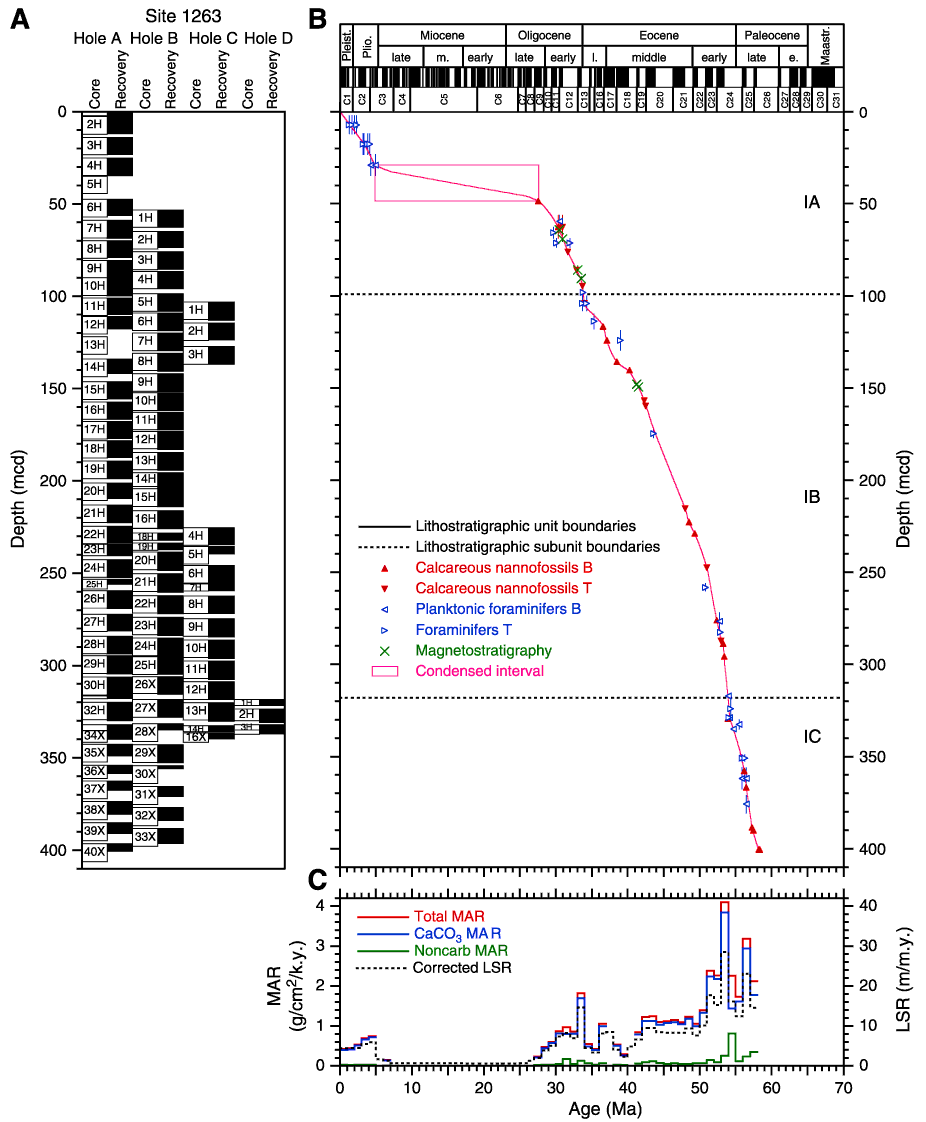
Figure F19. A. Core recovery plot for Site 1263. White boxes with core numbers = drilled intervals, which are spread out as a result of the composite depth construction, black boxes = the recovered intervals in each core. B. Shipboard biostratigraphic and magnetostratigraphic datums and the interpreted age-depth model. Solid horizontal lines = lithostratigraphic unit boundaries, dashed horizontal lines = lithostratigraphic subunit boundaries. C. Corrected linear sedimentation rates (LSR), total mass accumulation rates (Total MAR), carbonate mass accumulation rates (CaCO3 MAR), and noncarbonate mass accumulation rates (Noncarb MAR), calculated from the age model sampled at 1-m.y. intervals, and dry density and calcium carbonate concentrations averaged over the same 1-m.y. intervals. B = bottom, T = top.


![]()