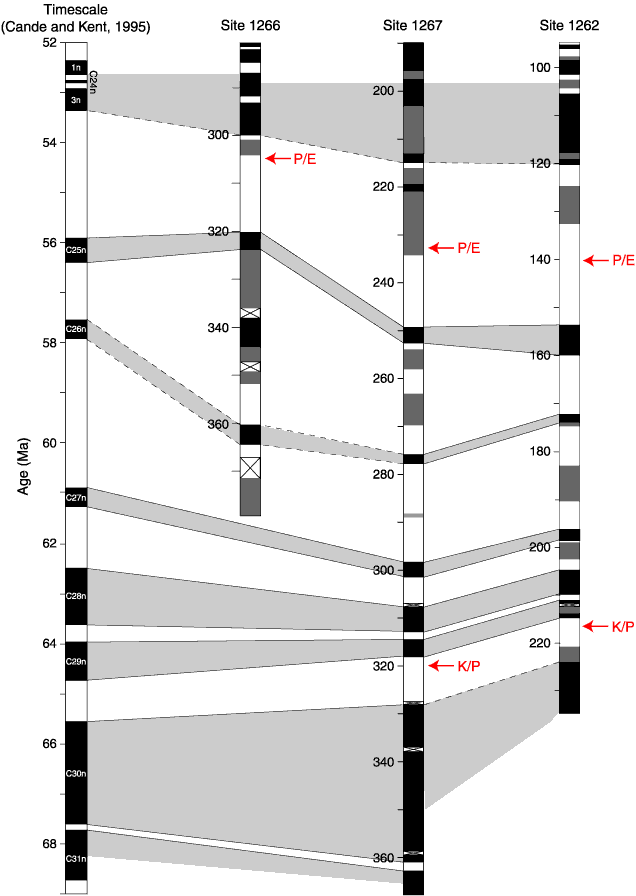
Figure F34. Maastrichtian, Paleocene, and lower Eocene magnetostratigraphic interpretation for Sites 1262, 1266, and 1267. Arrows = Paleocene/Eocene (P/E) and Cretaceous/Paleogene (K/P) boundaries. The geomagnetic polarity timescale (Cande and Kent, 1995) is plotted on the left. Black box = normal polarity, white box = reversed polarity, gray box = uncertain polarity. X = no core recovery. Correlation lines are dashed where approximate or uncertain.


![]()