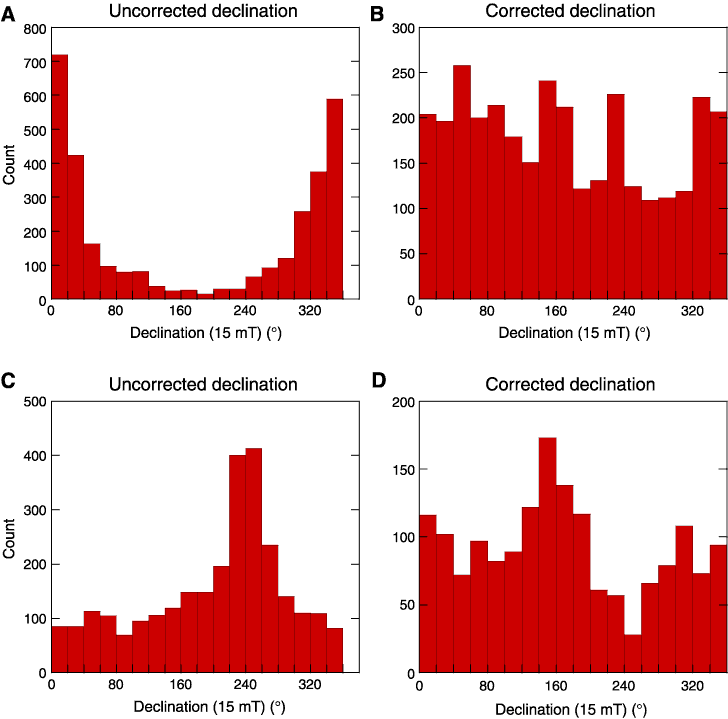
Figure F5. Example of bias in measured declination data. A. Declination data from unoriented archive halves from Hole 1266A. Declinations should be random but instead show a clear bias toward 0°. B. Declination data after core orientation with the Tensor tool (local declination = –22.73°). C. Declination data from unoriented whole cores from Hole 1266C. D. Declination data after core orientation with the Tensor tool. Declinations from the whole cores more closely approximate the expected bimodal distribution around 0° and 180°, although the distribution is far from ideal.


![]()