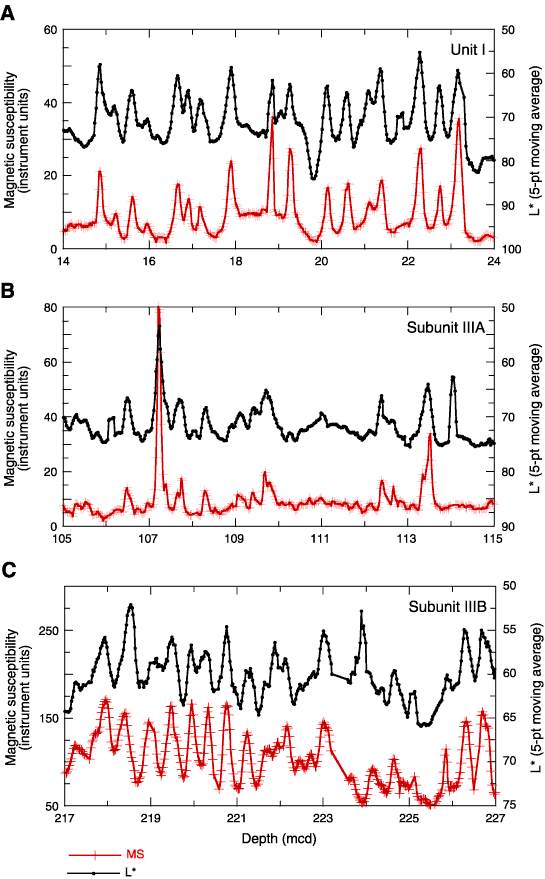
Figure F10. Example of cycles observed in signals of magnetic susceptibility (MS [black]) and sediment lightness (L* [red]) in (A) Unit I, (B) Subunit IIIA, and (C) Subunit IIIB. L* values were smoothed using a 5-point (5-pt) running average; MS measurements are
unsmoothed.


![]()