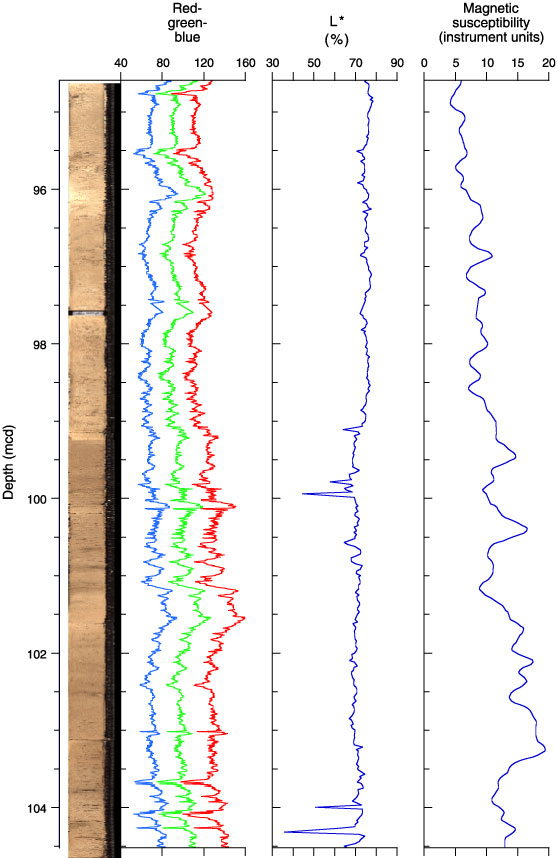
Figure F17.
Composite digital image, red-green-blue color variations, sediment lightness (L*), and magnetic susceptibility across the Eocene/Oligocene boundary interval (94.6–104.5 mcd), following the stratigraphic splice.