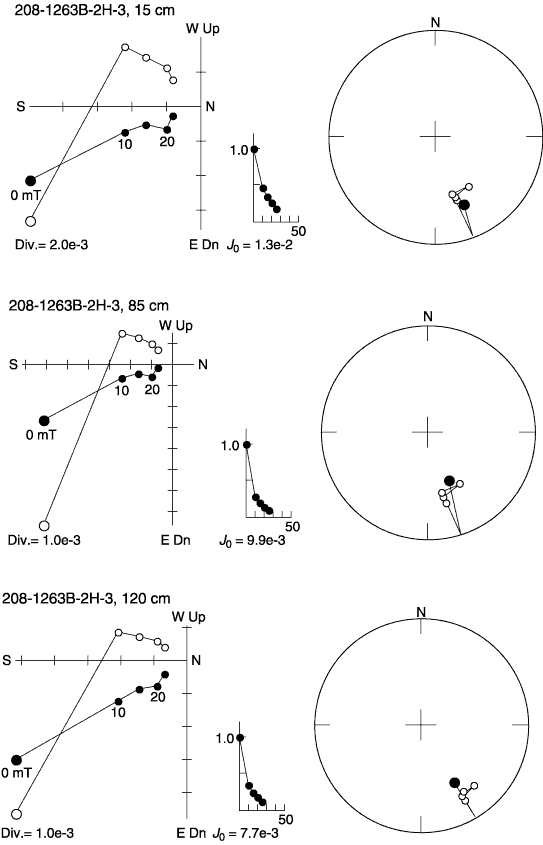
Figure F24. Typical examples of orthogonal vector endpoint (left), intensity (middle), and equal-area (right) diagrams for progressive demagnetization results from archive-half Section 208-1263B-2H-3. Open circles = vertical projection in the orthogonal diagram and the upper hemisphere in the equal area diagram, respectively.


![]()