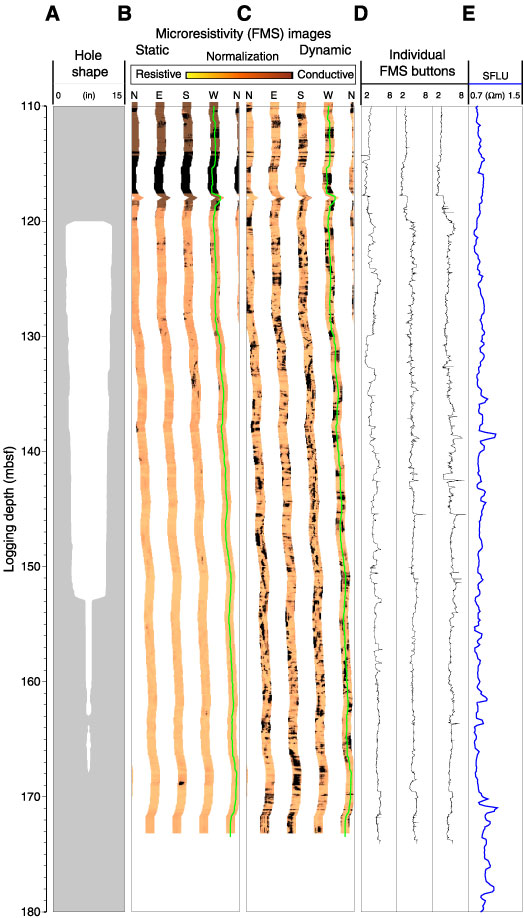
Figure F35. Formation MicroScanner (FMS) images and cyclostratigraphic limitations. A. Hole shape. B, C. Static and dynamic (window height = 0.5 m) normalization of the microresistivity images. D. Extracted FMS button records showing the weak amplitude of the resistivity measurement in spite of the good pad-formation contact. E. Shallow resistivity (SFLU) for comparison.