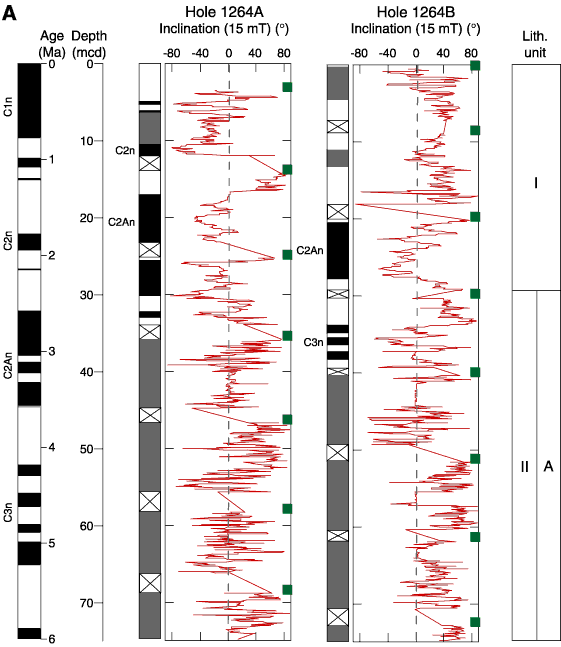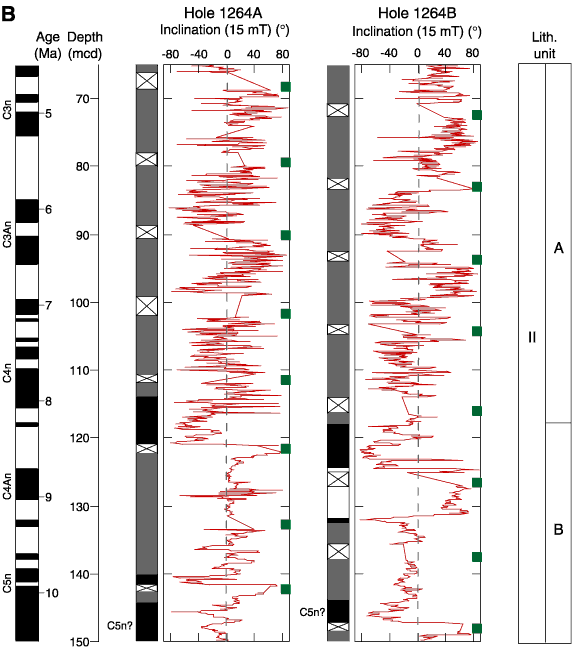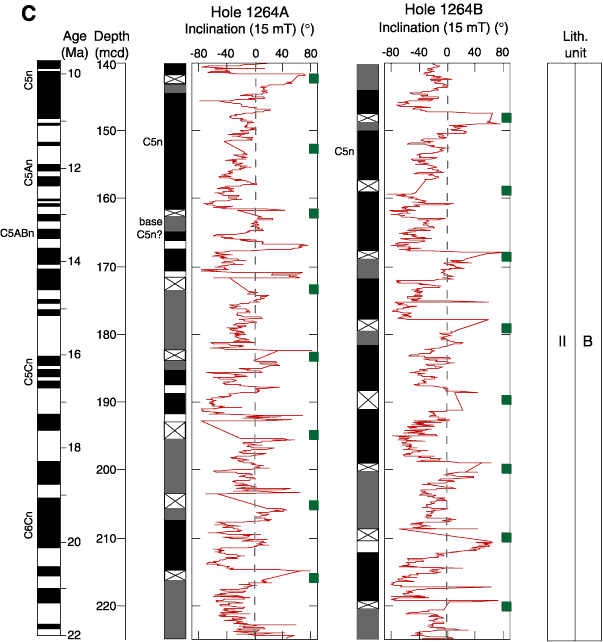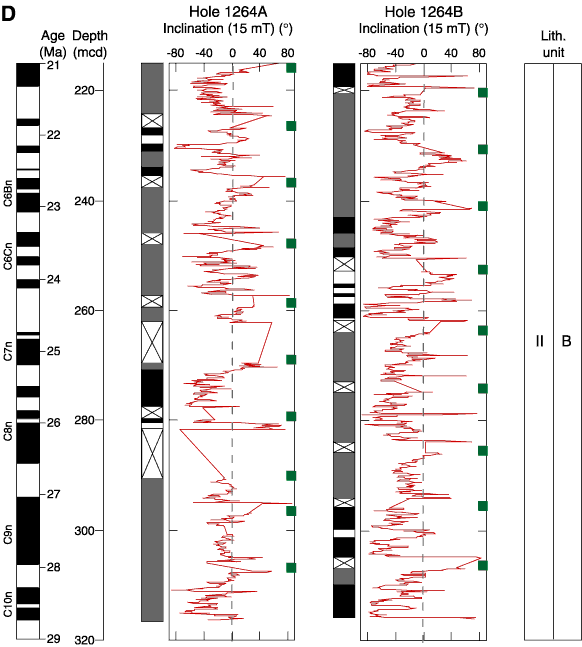
Figure F23. Preliminary magnetostratigraphic interpretation. Inclination data (at 15 mT) shown for Holes 1264A and 1264B. Data within 50 cm of a core top and 5 cm of section ends are not shown. Core breaks are denoted by green squares. Black rectangle = normal polarity, white = reversed polarity, shaded = uncertain polarity. X = intervals with no core recovery. A. 0–75
mcd. B. 65–150 mcd. C. 140–225 mcd. D.
115–320 mcd.


![]()