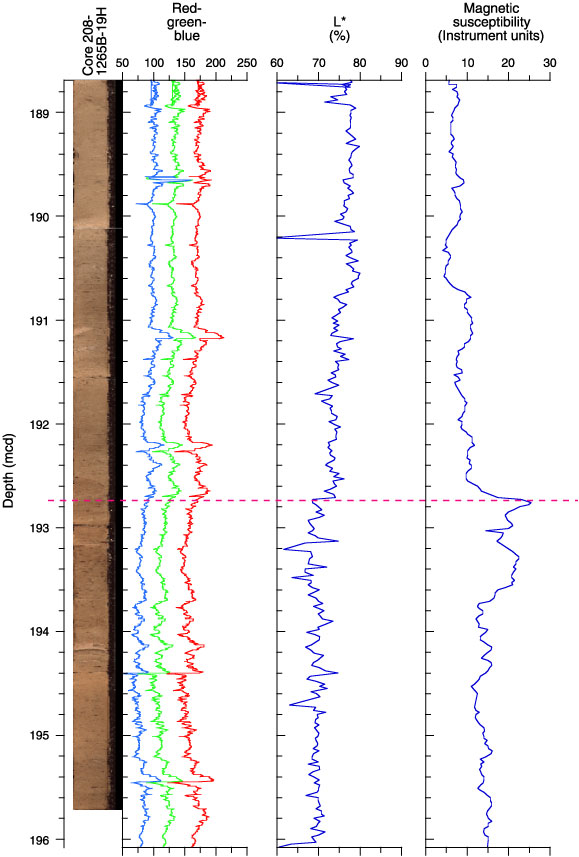
Figure F17. Composite digital image, red-green-blue (RGB) color variation, sediment lightness (L*), and magnetic susceptibility across the Eocene–Oligocene transition interval from ~189 to ~196 mcd (Sections 208-1265B-19H-1, 0 cm, to 19H-5, 140 cm; 166.21–163.60 mbsf). The lithostratigraphic boundary between Subunits IIA/IIB (~192.7 mcd; dotted line) is approximately near the Eocene/Oligocene boundary and is reflected by a step increase in magnetic susceptibility and step decrease in RGB color variation and L*.