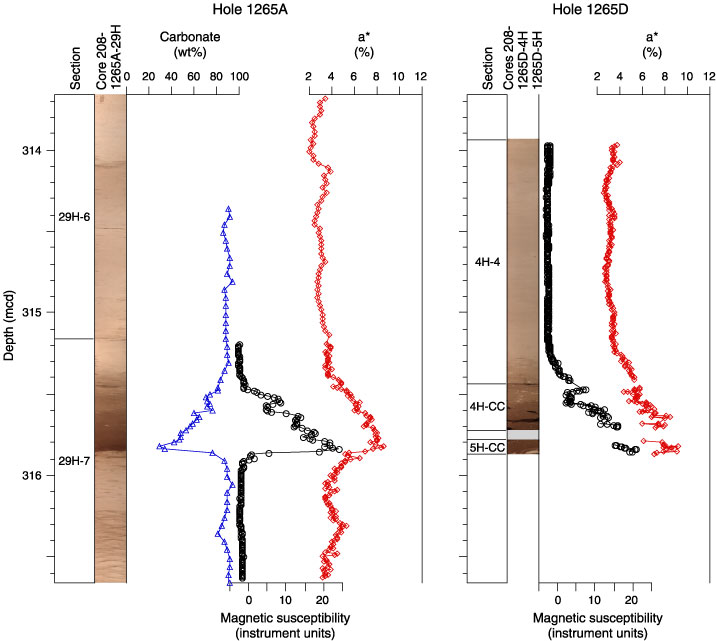
Figure F23. Composite digital image, carbonate content (blue), magnetic susceptibility (black), and chromaticity (a*; red) across the Paleocene/Eocene boundary from ~313.7 to ~316.6 mcd (Sections 208-1265A-29H-6 through 29H-7 and 208-1265D-4H-4 through 5H-CC).