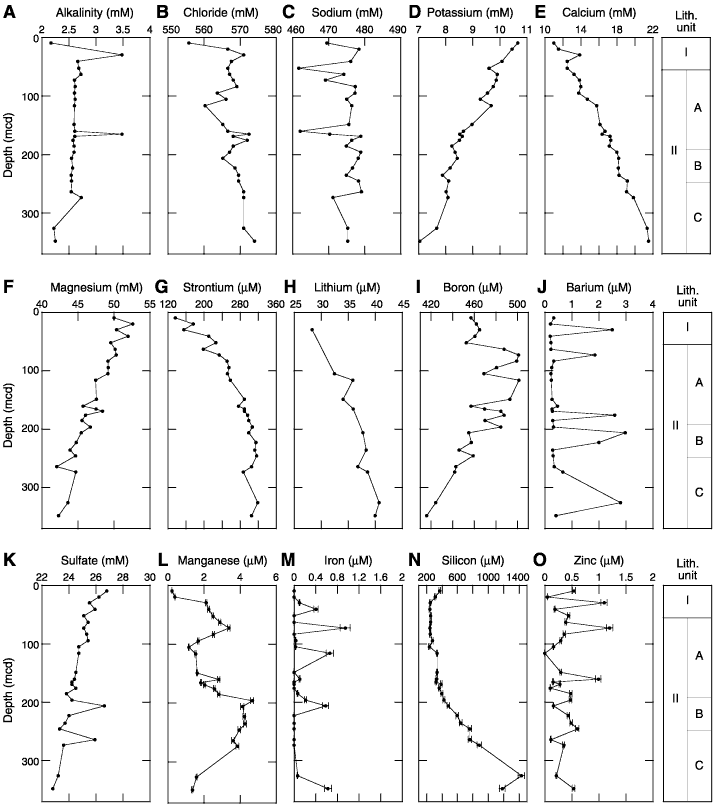
 relative standard deviation as a percentage) are plotted where they are larger than the plot symbols. A. Alkalinity. B. Chloride. C. Sodium. D. Potassium. E. Calcium. F. Magnesium. G. Strontium. H. Lithium. I. Boron. J. Barium. K. Sulfate. L. Manganese. M. Iron. N. Silica. O. Zinc.

![]()