Figure F41. Core-log integration. A. Hole shape and total gamma radiation (HSGR), porosity (APLC), density (RHOM), P-wave velocity (VP), plotted along with the equivalent data from cores, lithostratigraphy, and logging subunits.
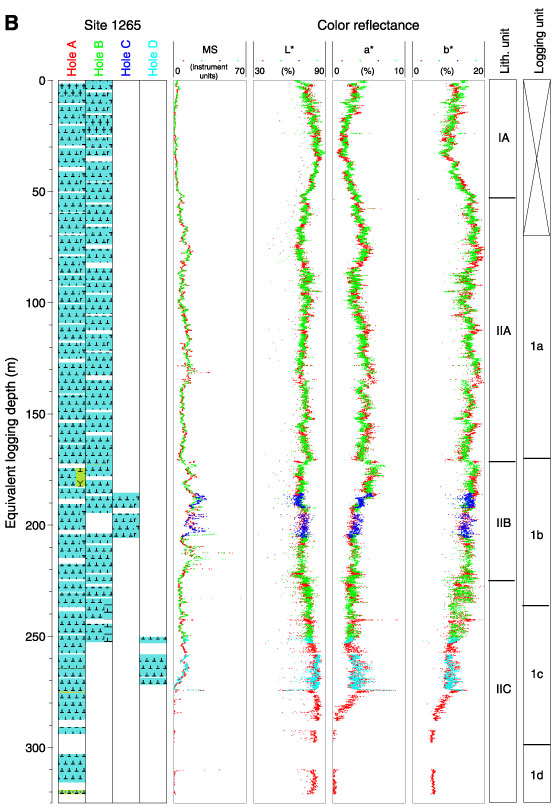
B. Lithology, magnetic susceptibility, and color reflectance
data (L*, a*, and b*) from cores and lithostratigraphic and logging units vs.
equivalent logging depth.