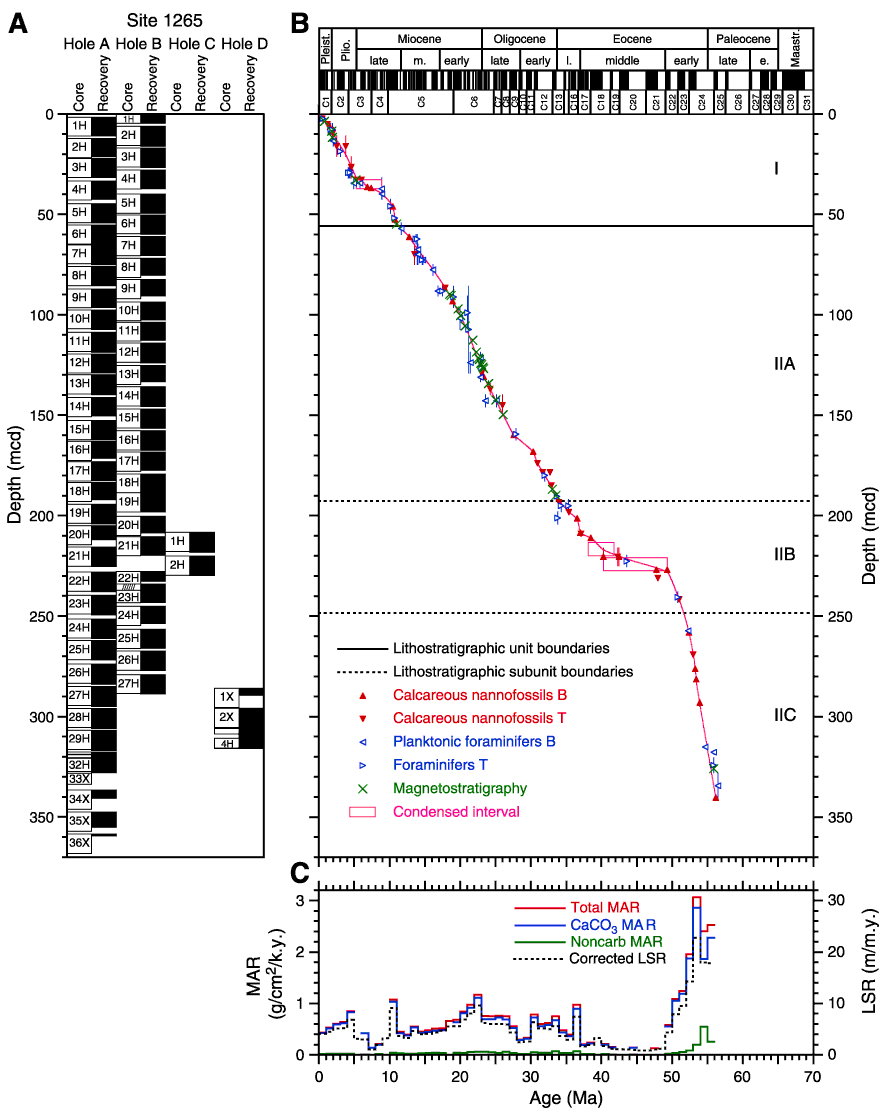
Figure F48. A. Core recovery plot. B. Shipboard biostratigraphic and magnetostratigraphic datums and the interpreted age-depth model. C. Corrected linear sedimentation rate (LSR), total, carbonate, and noncarbonate mass accumulation rates (MAR), calculated from the age model sampled at 1-m.y. intervals, and dry density and calcium carbonate concentrations averaged over the same 1-m.y. intervals. T = top, B = bottom.


![]()