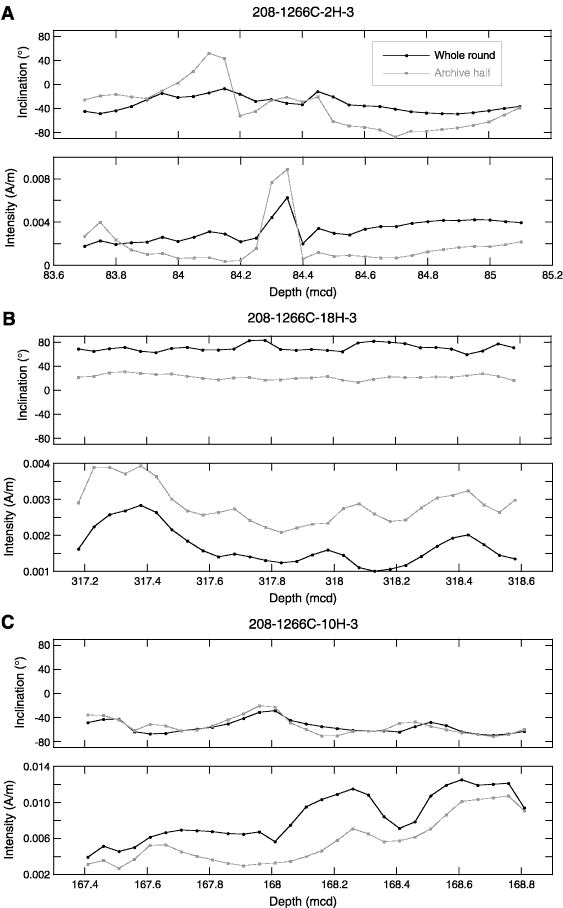
Figure F22. Inclination and intensity data from test sections before and after splitting. A. Section 208-1266C-2H-3. All data shown after maximum demagnetization to 10 mT. B. Section 208-1266C-18H-3 shown after maximum demagnetization to 15 mT. C. Section 208-1266C-10H-3 shown after maximum demagnetization to 15
mT.


![]()