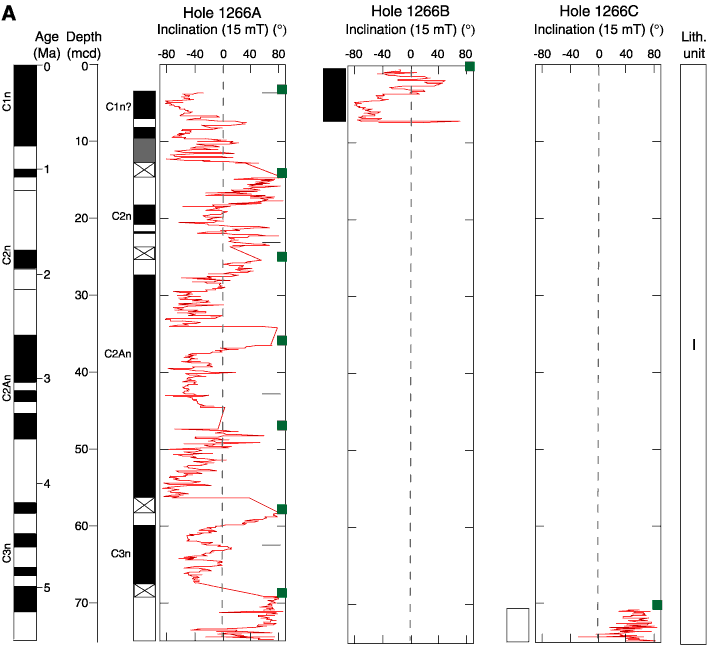
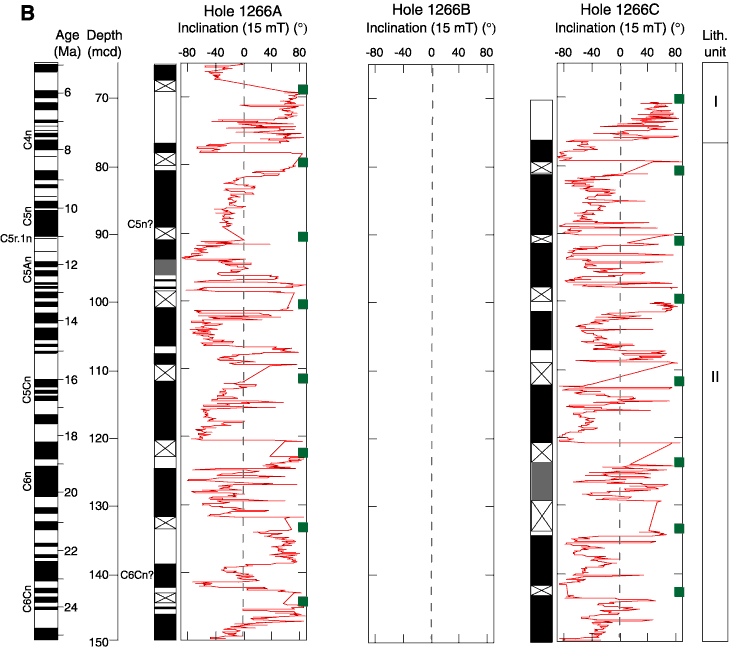
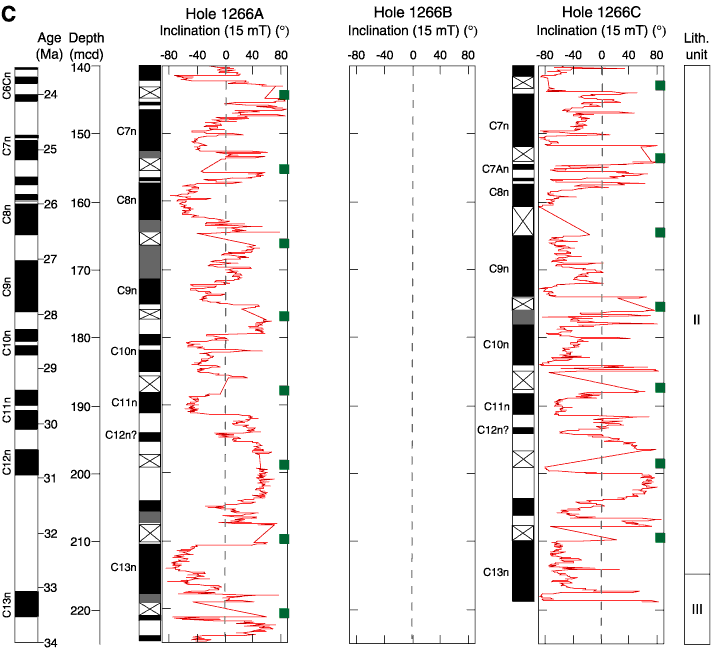
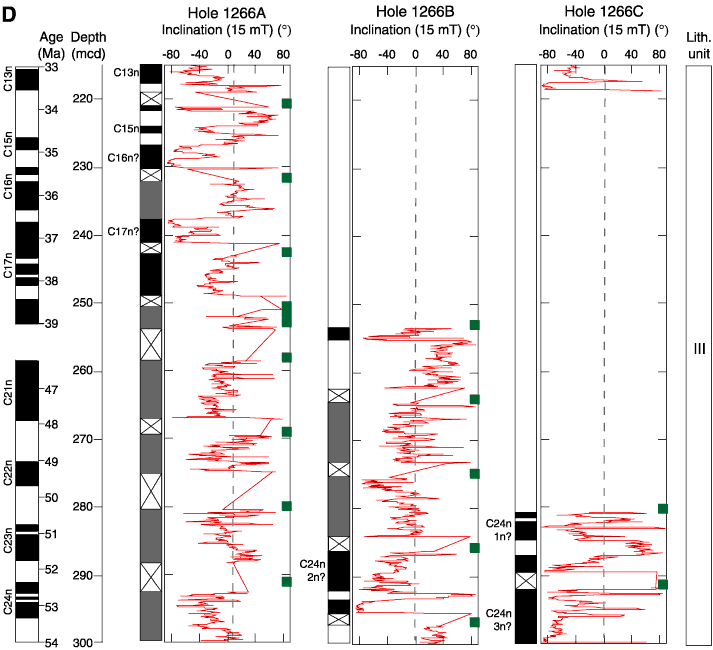
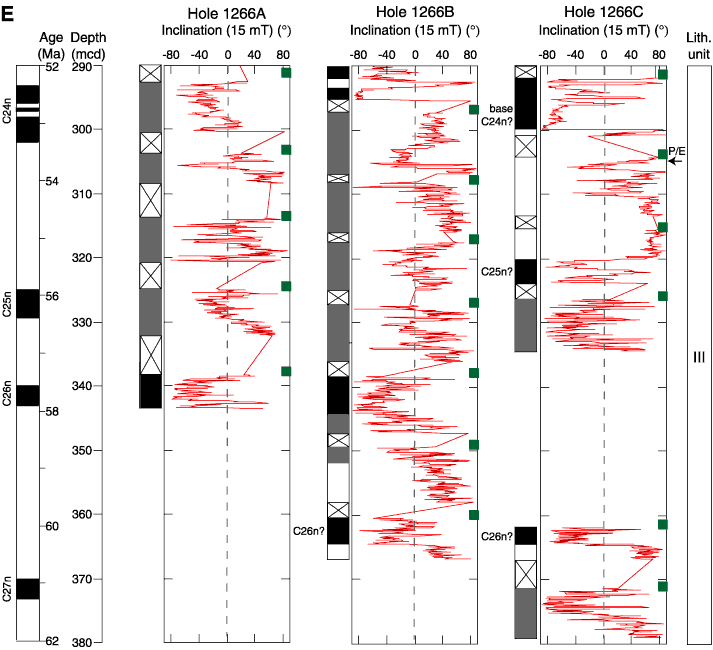
Figure F26. Preliminary magnetostratigraphic interpretation. Inclination data are shown for Holes 1266A, 1266B, and 1266C. Hole 1266A and 1266B data are from archive halves demagnetized to 15 mT. Hole 1266C data are from whole rounds. Cores 208-1266C-1H through 3H (data above 100 mcd) were demagnetized only to 10 mT. Cores from the remainder of the hole were demagnetized to 15 mT. Data within 50 cm of a core top and 5 cm of section ends are not shown. Core breaks are denoted by green squares. Black rectangle = normal polarity, white = reversed polarity, and shaded = uncertain polarity. X = intervals with no core recovery. A. 0–75
mcd. B. 65150 mcd. C. 140225 mcd. D.
215300 mcd. E. 290380 mcd.