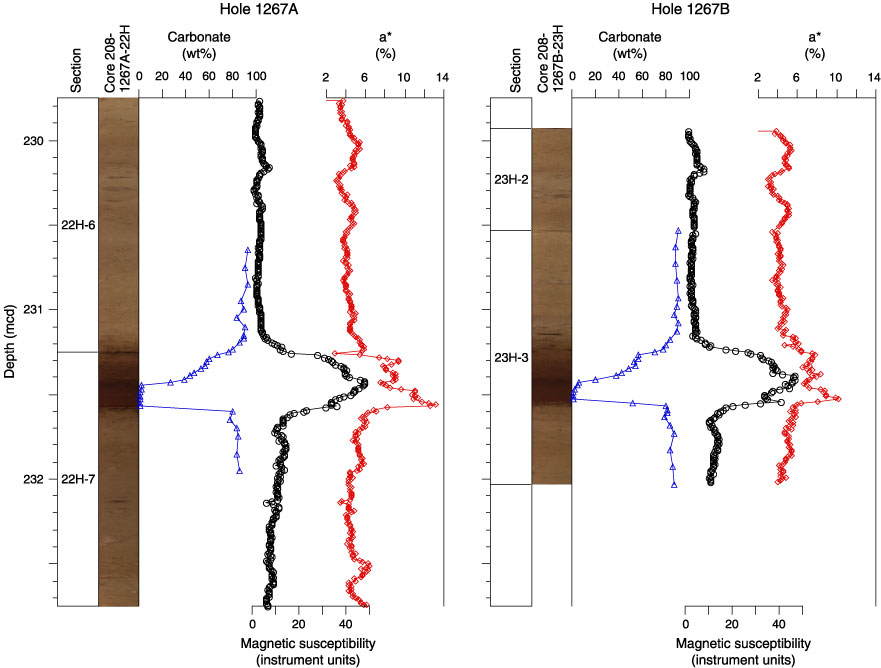
Figure F15.
Composite digital images, magnetic susceptibility (black), carbonate content (blue), and chromaticity a* (red) across the P/E boundary in Cores 208-1267A-22H and 208-1267B-23H.