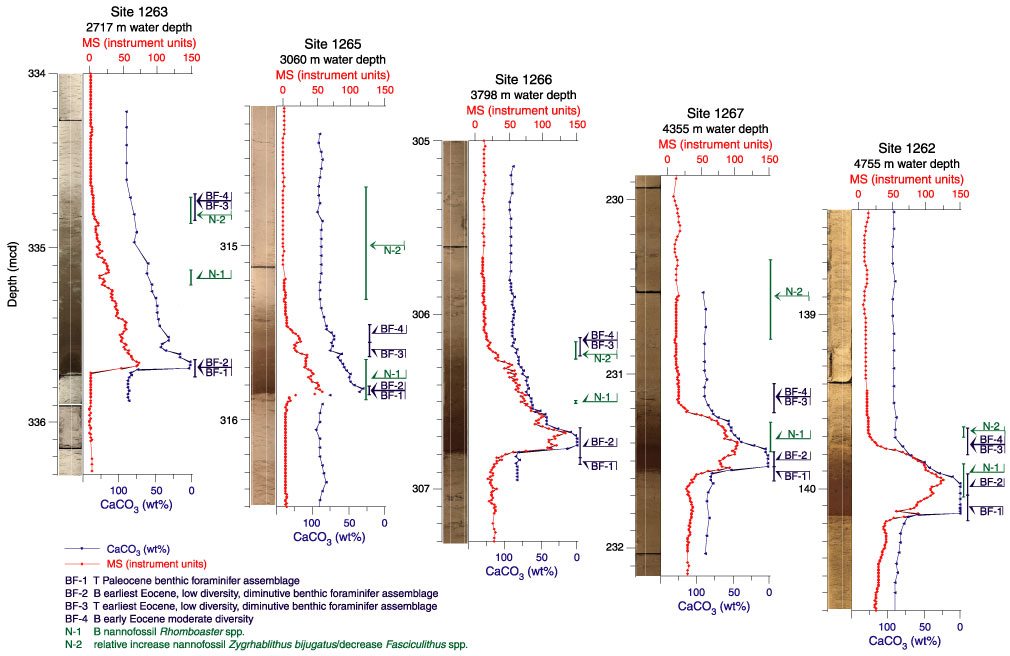
Frontispiece. Composite
digital images, magnetic susceptibility (MS), and CaCO3 through the
PaleoceneEocene transition at the shallow to deep transect. The MS graphs
represent both point magnetic susceptibility (PMS) data measured on the split
core and loop sensor (MSL) data measured on the whole core. For correlation of
these two methods, 1-cm resolution PMS data were linearly interpolated at 2.5-cm
resolution, after which a linear expansion formula was calculated and PMS values
were normalized to MSL values: MSL = 2.0683 ![]() PMS + 7.8257 (r2
= 0.9885). For Site 1263, MS data from Hole 1263C are spliced with data from
Hole 1263D at 335.88 meters composite depth (mcd). Sample depths for Hole 1263D
were normalized to Hole 1263C mcd using a linear expansion based on PMS
correlation through the P/E transition: Hole 1263C mcd = Hole 1263D mcd
PMS + 7.8257 (r2
= 0.9885). For Site 1263, MS data from Hole 1263C are spliced with data from
Hole 1263D at 335.88 meters composite depth (mcd). Sample depths for Hole 1263D
were normalized to Hole 1263C mcd using a linear expansion based on PMS
correlation through the P/E transition: Hole 1263C mcd = Hole 1263D mcd ![]() 1.383
128.45. For Site 1262, sample depths of CaCO3 data from Hole
1262A (Core 208-1262A-13H) were normalized to Hole 1262B mcd using a linear
expansion based on PMS correlation through the lower part of the P/E transition:
Hole 1262B mcd = Hole 1262A mcd
1.383
128.45. For Site 1262, sample depths of CaCO3 data from Hole
1262A (Core 208-1262A-13H) were normalized to Hole 1262B mcd using a linear
expansion based on PMS correlation through the lower part of the P/E transition:
Hole 1262B mcd = Hole 1262A mcd ![]() 1.1343 18.785 (r2 =
0.996; only for data below 139.95 mcd). At Site 1266, CaCO3 data from
Hole 1266B (Section 208-1266B-6H-7) give way to Hole 1266C values at 306.56 mcd.
T = top (last occurrence), B = bottom (first occurrence).
1.1343 18.785 (r2 =
0.996; only for data below 139.95 mcd). At Site 1266, CaCO3 data from
Hole 1266B (Section 208-1266B-6H-7) give way to Hole 1266C values at 306.56 mcd.
T = top (last occurrence), B = bottom (first occurrence).