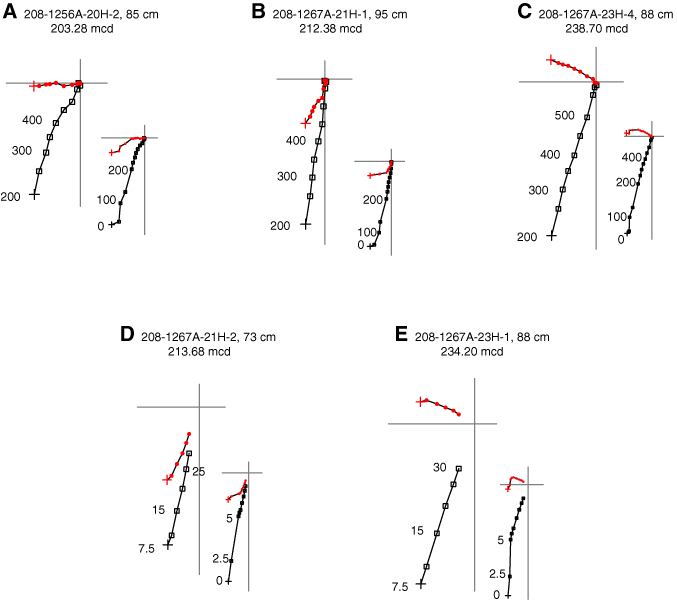
Figure F3. A–C. Representative vector endpoint diagrams from thermal demagnetizations. Horizontal projection shown with solid red dots, vertical projection shown with open squares. Temperature steps indicated in degrees Celsius. D, E. AF demagnetization results from adjacent samples for comparison. Demagnetization steps are shown in mT.


![]()