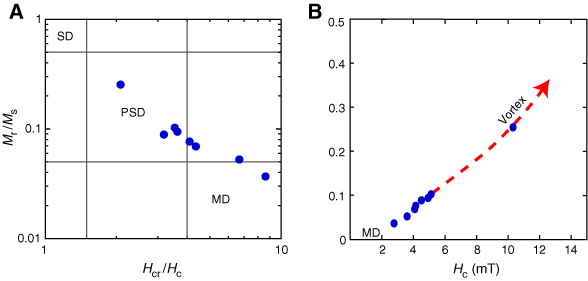
Figure F7. Hysteresis parameters of samples from Hole 1267A. A. Results plotted on a typical Day diagram fall predominantly in the pseudo-single-domain (PSD) to multidomain (MD) regions. B. The same data plotted as squareness (Mr/Ms) vs. Hc as in Tauxe et al. (2002) show that samples plot along a mixing line between MD and the vortex state that is transitional to single domain (SD).


![]()