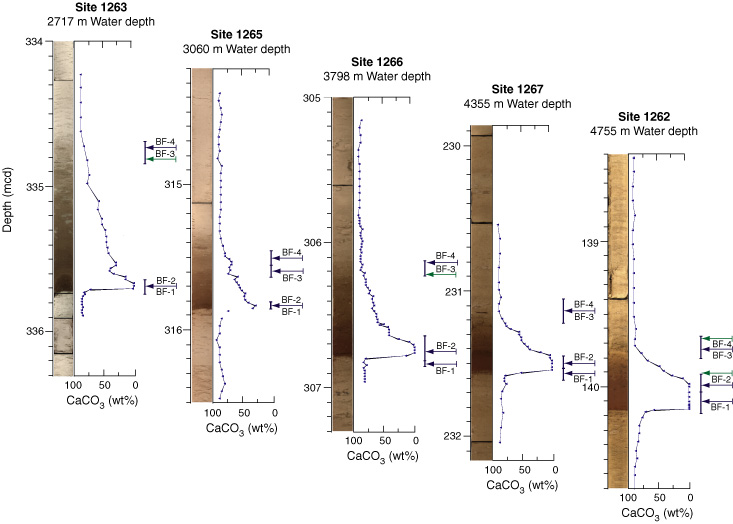
Figure F13. Digital core photos and CaCO3 content plotted vs. depth across the P/E boundary interval in Holes 1262A, 1263C/1263D, 1265A, 1266C, and 1267B on Walvis Ridge (Zachos, Kroon, Blum et al., 2004; Zachos et al., 2005). Records are plotted from left to right in order of increasing water depth. The core photos for each site represent composites of the following sections: 208-1262A-13H-5 and 13H-6; 208-1263C-14H-1 and 14H-CC; 208-1263D-4H-1 and 4H-2; 208-1265A-29H-6 and 28H-7; 208-1266C-17H-2, 17H-3, and 17H-44; and 208-1267B-23H-1, 23H-2, and 23H-3. BF-1 = last occurrence (LO) of Paleocene benthic foraminifer assemblage. BF-2 and BF-3 = first occurrence (FO) and LO, respectively, of lowermost Eocene, low-diversity, diminutive benthic foraminifer assemblage. BF-4 = FO of early Eocene moderate diversity benthic foraminifer assemblage.