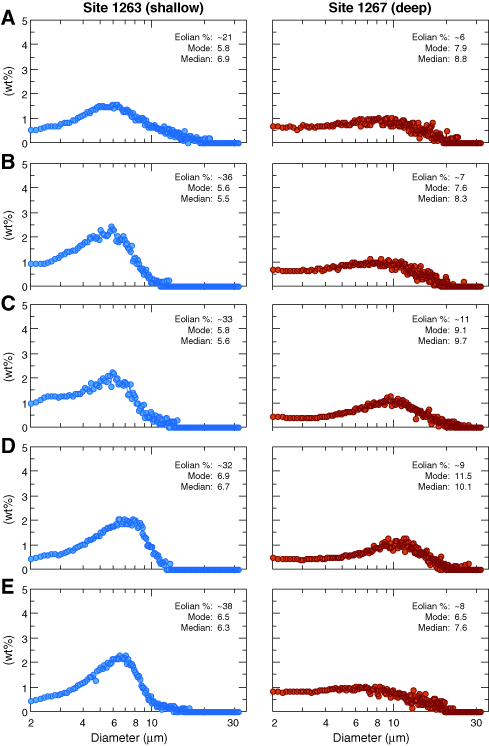
Figure F17. Site 1263 and 1267 grain-size distributions. Five sets of time-coincident (less than ~16 k.y. difference) grain-size distributions are illustrated, such that each pane (A–E) contains one distribution from the shallower Site 1263 and one distribution from the deeper Site 1267. All distributions are plotted on identical axes. Eolian percent calculated after the two-component mixing model of Boven and Rea (1998).


![]()