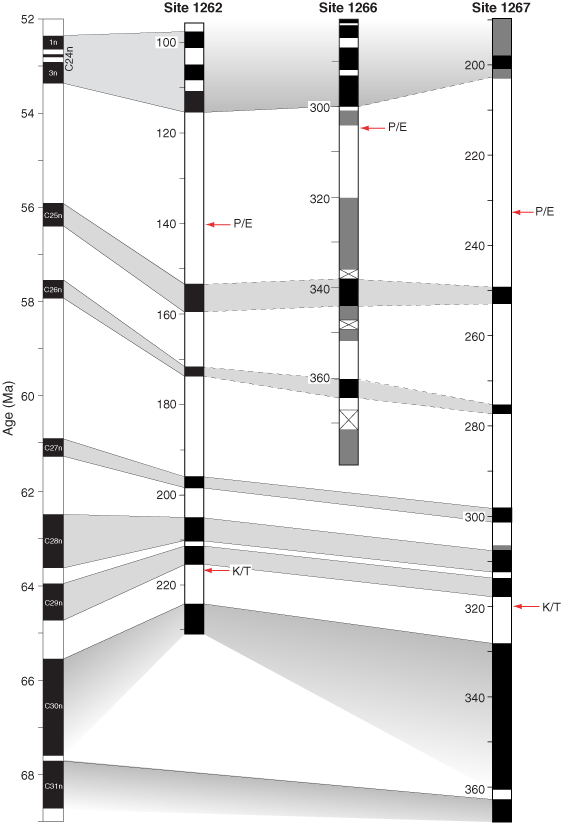
Figure F6. Magnetostratigraphic interpretation for the Paleocene and Upper Cretaceous for Sites 1262, 1266, and 1267. Depth for each site is given in mcd. Polarity column: black = normal, white = reverse, gray = uncertain, X = no core recovery. Dashed correlations are approximate or uncertain. GPTS timescale of Cande and Kent (1995) is shown at left for reference. P/E = Paleocene/Eocene boundary, K/T = Cretaceous/Tertiary boundary.


![]()