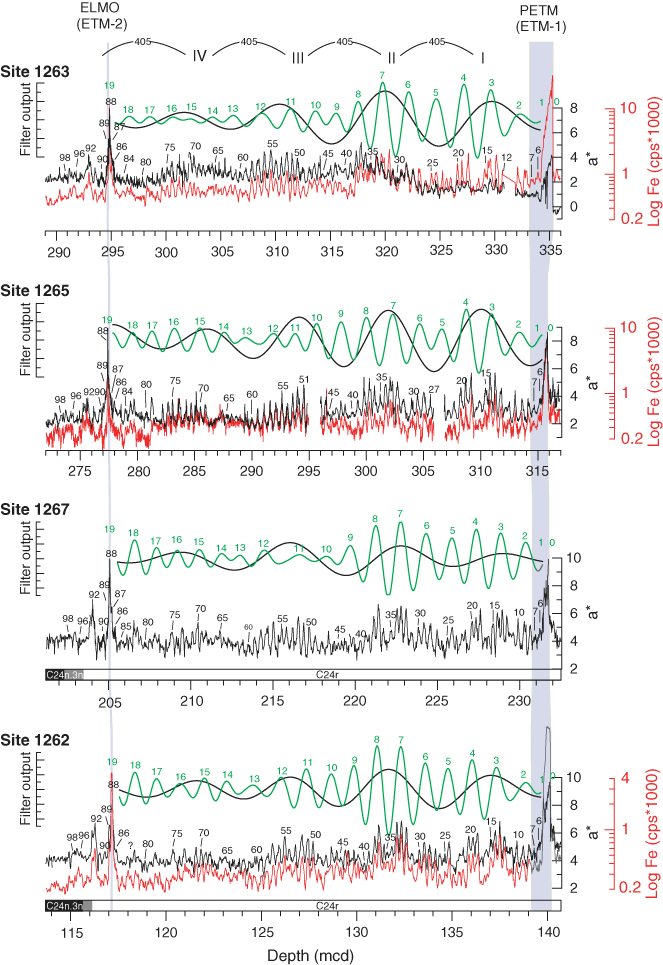
Figure F7. Cycle counting of early Eocene and late Paleocene sediments at Walvis Ridge using color reflectance a* value (black plot) and high-resolution XRF Fe intensity data (red plot) (Sites 1262, 1263, and 1265). For each site the small black numbers indicate the number of precession cycles relative to the onset of the Paleocene/Eocene Thermal Maximum (PETM). The PETM (thick shaded bar) and the Elmo layer (thin shaded bar) are, according to precession cycle counting, 88 cycles apart; thus, the Elmo layer is labeled cycle 88. Short (green) and long (black) eccentricity cycles have been extracted by Gaussian filtering of the a* value (Sites 1267 and 1265) and Fe intensity data (Sites 1262 and 1263). For Site 1262: filter frequency for the long eccentricity cycle = 0.19 ± 0.057 cycles/m; short eccentricity cycle = 0.80 ± 0.24 cycles/m. Site 1267: long cycles = 0.15 ± 0.045 cycles/m; short = 0.66 ± 0.20 cycles/m. Site 1263: long cycles = 0.10 ± 0.03 cycles/m; short = 0.41 ± 0.123 cycles/m. Site 1265: long cycles = 0.12 ± 0.036 cycles/m; short = 0.46 ± 0.138 cycles/m. Green numbers indicate the short eccentricity maxima, where cycle 0 comprises the PETM; thus, the distance between the PETM and Elmo layer is 19 short eccentricity cycles. In addition, we labeled the long eccentricity maxima with roman numbers –VI to IV relative to the PETM. Eocene thermal maxima 1 (ETM-1) and 2 (ETM-2) represent the PETM and Elmo, respectively. From Westerhold et al. (in press).


![]()