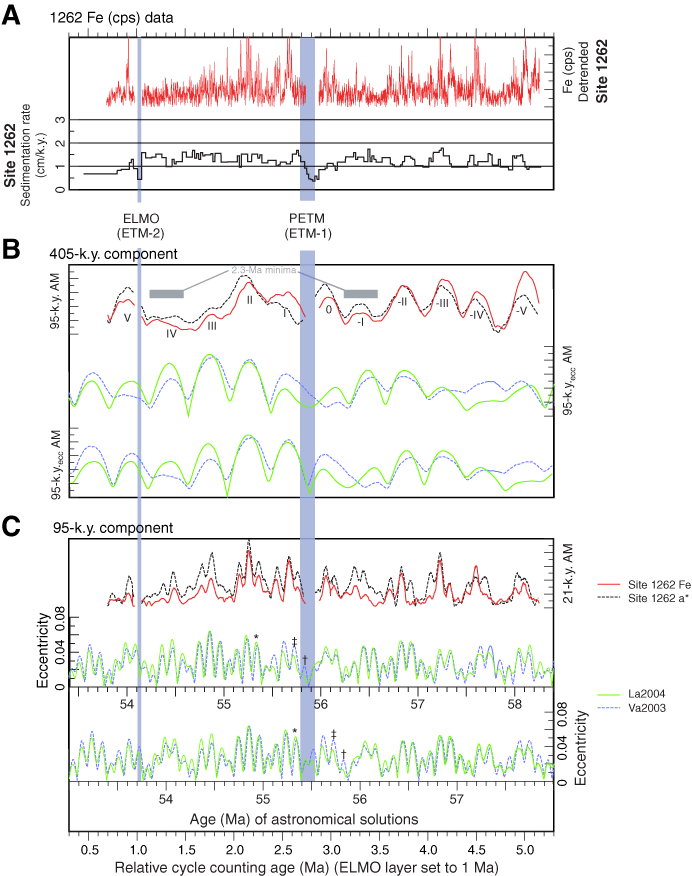
Figure F8. Comparison of relative cycle counting timescale with present astronomical solutions for orbital eccentricity. A. Results of relative timescale. Site 1262 detrended Fe intensity data vs. relative cycle counting age. We assume that the mean duration of one precession cycle is 21.0 k.y., and we set the Elmo layer (ETM-2) arbitrarily to 1.0 Ma. In contrast, the regions containing the Elmo layer and the Paleocene/Eocene Thermal Maximum (PETM; ETM-1) reveal lower than mean sedimentation rates due to strong dissolution of calcium carbonates (for discussion see Lourens et al., 2005; Zachos et al., 2005). B, C. Comparison of current astronomical solutions plotted against absolute time and the extracted amplitude modulation of Site 1262 data plotted against relative time. We shifted the Site 1262 data with respect to the best fit with the 405-k.y. cycle. For further explanation see text. (B) Short eccentricity cycle amplitude modulation of Site 1262 Fe intensity, a*, La2004 (Laskar et al., 2004), and Va2003 (Varadi et al., 2003) orbital eccentricity solutions. For comparison, the La2004 and Va2003 amplitude modulations (AM) are plotted from 53 to 58 Ma (lower plot) and 53.4 to 58.4 Ma (middle plot). (C) Climatic precession cycle AM of Site 1262 data (Fe, a*) compared to orbital eccentricity solutions La2004 and Va2003 from 53 to 58 Ma (lower plot) and 53.4 to 58.4 Ma (middle plot). Additionally, the 2.3-Ma eccentricity minima in Site 1262 data are marked (see text for discussion). AMs were extracted using the program Envelope (Schulz et al., 1999). –V through V = eccentricity maxima. GTS = geological timescale. * = age onset of PETM (Wing et al., 2000), † = age onset of PETM GTS2004 (Gradstein et al., 2004), ‡ = recalibrated radiometric age estimate of PETM onset. From Westerhold et al. (in press).


![]()