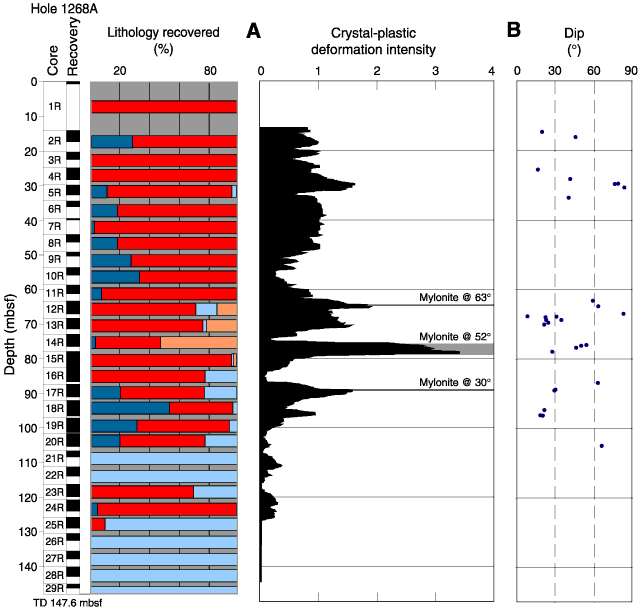
Figure F43. Variation in crystal-plastic deformation intensity and orientation of crystal-plastic foliation with depth. A. Plot of average deformation intensity vs. depth. The locations of major mylonite zones are also shown as gray bands. B. Plot of the dip of the crystal-plastic foliation in the core reference frame vs. depth. TD = total depth.