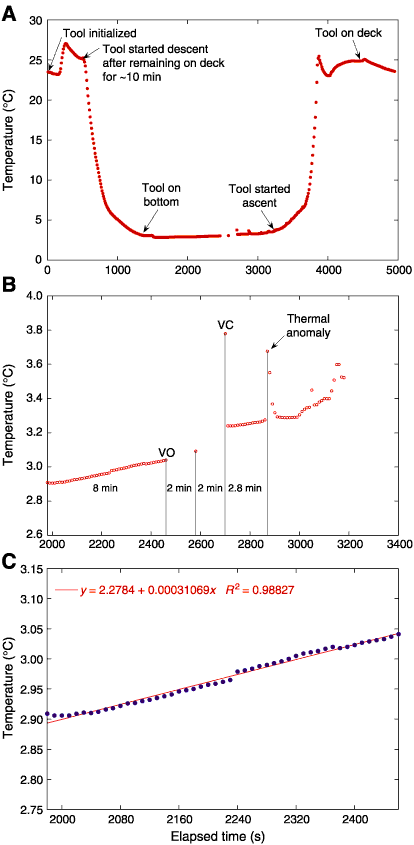
Figure F97. Temperature results of ocean bottom water from the WSTP deployment prior to drilling operations in Hole 1268A. A. Entire temperature-time series showing the temperature response of the WSTP prior to, during, and after the deployment. B. Expanded section of the temperature changes while the WSTP was lowered to a depth of 2 m above seafloor. This profile shows the rising temperatures before collecting a water sample, the time when the water-sampling valve opened (VO), when the valve closed (VC), and a thermal anomaly after the valve closed. C. A linear fit to the temperature time-series data before the water-sampling valve opened.


![]()