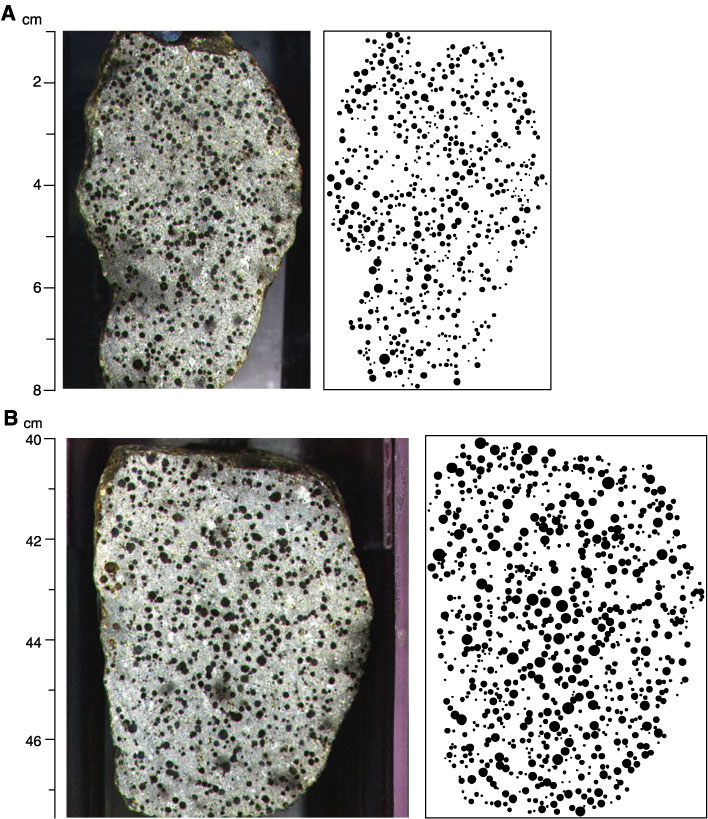
Figure F5.
Comparison of the photographic images and the idealized binary images of bubble size distribution produced by computer analysis.
A.
Sample 209-1269B-1R-1, 0–8 cm.
B.
Sample 209-1269B-1R-1, 39–47 cm.