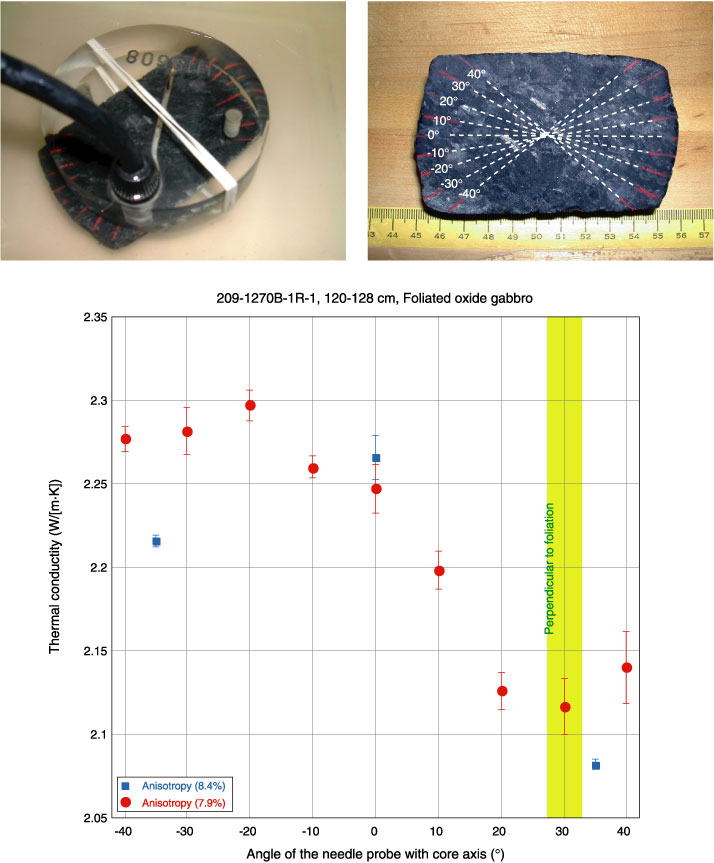
Figure F108. Apparent thermal conductivity anisotropy in Sample 209-1270B-1R-1, 120-128 cm. The error bars show the standard errors in our measurements (Table T6). Blue squares are the regular series of three measurements made earlier a few days before the series of 10° interval measurements (red circles).