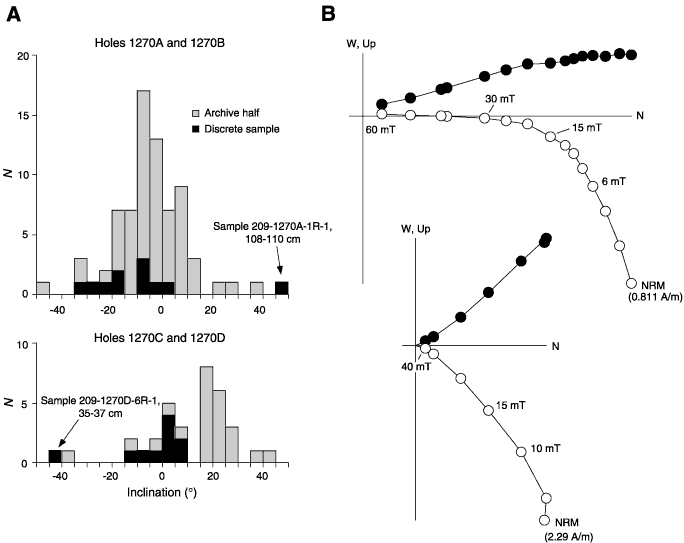
Figure F114. A. Histograms of paleomagnetic inclinations from Holes 1270A and 1270B (top) and 1270C and 1270D (bottom). Note the difference between inclinations determined from discrete samples (black) and archive halves (gray). B. Vector endpoint diagrams for the same depth interval determined from a discrete sample (top) (Sample 209-1270D-3R-2, 49–51 cm) and an archive half (bottom) (Section 209-1270D-3R-2, 50 cm). NRM = natural remanent magnetization. Solid circles = projections onto the horizontal plane and open circles = projections onto the vertical plane.


![]()