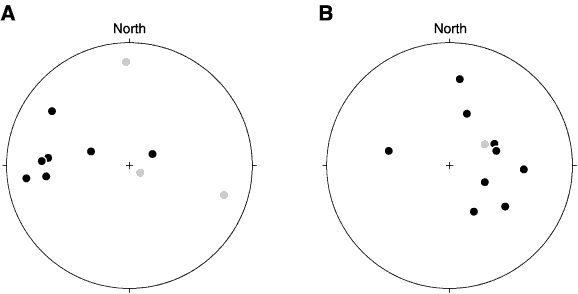
Figure F117. Lower hemisphere equal-area projections of minimum eigenvector of the susceptibility tensor for (A) Hole 1270B and (B) Holes 1270C and 1270D. Black symbols = samples with foliation larger than lineation, gray symbols = samples with foliation smaller than lineation.


![]()