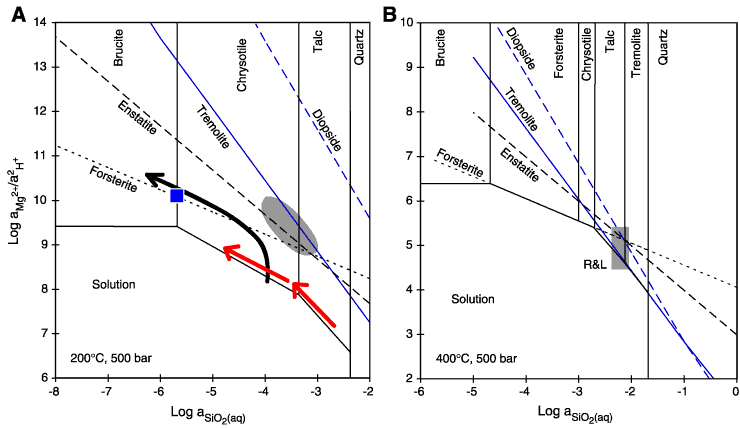
Figure F34. A. Mineral-fluid phase diagram for the system Mg-Ca-Si-O-H at 200°C and 500 bar, constructed using thermodynamic data from Johnson et al. (1992) and assuming log( Ca2+/
Ca2+/ 2H+) = 6. Black trend = hypothetical evolution path of fluids dissolving olivine at a higher rate than hydrous minerals are precipitated. The drop in silica activity is solely the result the decrease in the orthosilicate activity coefficient as a function of decreasing pH (calculated with SUPCRT92; Johnson et al., 1992). Black square = hydrothermal fluids from the Lost City vent site (Kelley et al., 2001) respeciated for 200°C and 500 bar and assuming olivine solubility controls aMg2+. The shaded field encompasses fluid compositions from a lherzolite-seawater reaction experiment at 200°C and 500 bar conducted by Janecky and Seyfried (1986). Red arrows = schematic fluid evolution paths for pyroxene-poor lithologies proposed by Seyfried and Dipple (1980). B. Same as A but for T = 400°C. The shaded field labeled "R&L" represents fluid compositions from the Rainbow and Logatchev hydrothermal sites, respeciated for 400°C and 500 bar (Charlou et al., 2002). In situ pH values of these fluids range 4.5–5. Silica activities = 6–7 mmol/kg, and Mg2+ activity was assumed to be 0.1
mmol/kg.


 Ca2+/
Ca2+/ 2H+) = 6. Black trend = hypothetical evolution path of fluids dissolving olivine at a higher rate than hydrous minerals are precipitated. The drop in silica activity is solely the result the decrease in the orthosilicate activity coefficient as a function of decreasing pH (calculated with SUPCRT92; Johnson et al., 1992). Black square = hydrothermal fluids from the Lost City vent site (Kelley et al., 2001) respeciated for 200°C and 500 bar and assuming olivine solubility controls aMg2+. The shaded field encompasses fluid compositions from a lherzolite-seawater reaction experiment at 200°C and 500 bar conducted by Janecky and Seyfried (1986). Red arrows = schematic fluid evolution paths for pyroxene-poor lithologies proposed by Seyfried and Dipple (1980). B. Same as A but for T = 400°C. The shaded field labeled "R&L" represents fluid compositions from the Rainbow and Logatchev hydrothermal sites, respeciated for 400°C and 500 bar (Charlou et al., 2002). In situ pH values of these fluids range 4.5–5. Silica activities = 6–7 mmol/kg, and Mg2+ activity was assumed to be 0.1
mmol/kg.

![]()