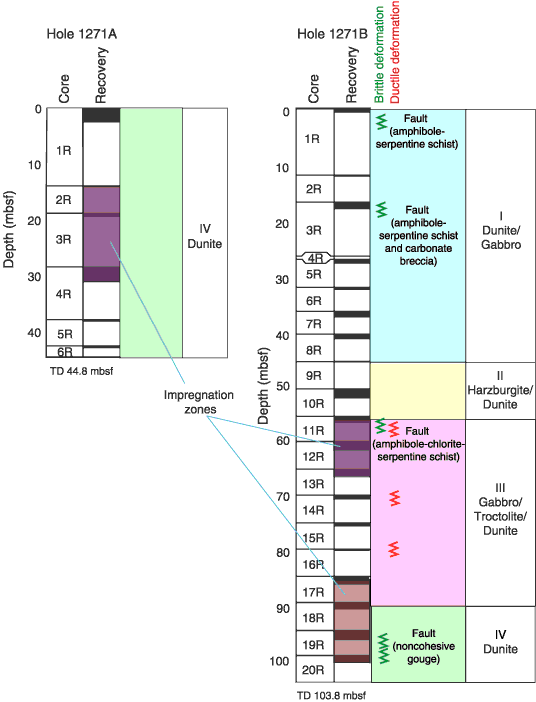
Figure F35. Plot showing recovery, unit boundaries, and the locations of brittle and ductile shear zones and impregnated horizons for Holes 1271A and 1271B. Green and red markers denote the locations of brittle and ductile shear zones. Purple shaded intervals on recovery plots denote the locations and thickness of impregnated horizons. TD = total depth.


![]()