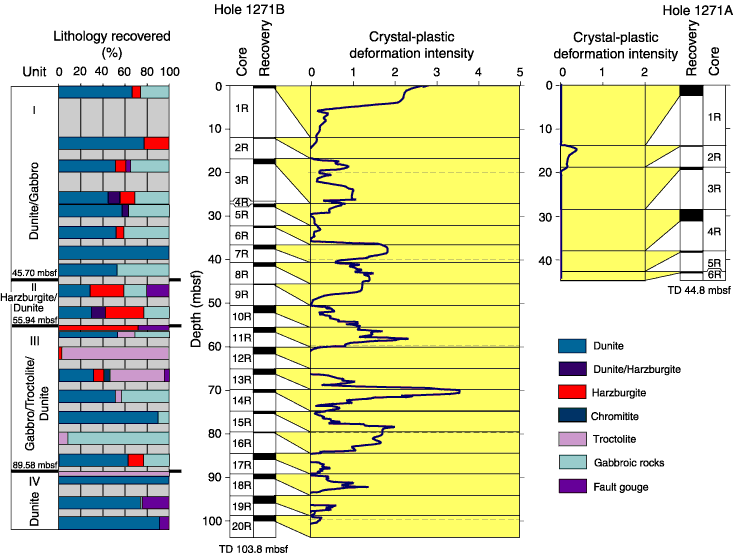
Figure F36. Downhole plot of crystal-plastic deformation intensity for Holes 1271A and 1271B. Plot for Hole 1271A represents a five-piece running average, weighted by piece length, for deformation intensities measured on 102 pieces of core. Plot for Hole 1271B represents a seven-piece running average, weighted by piece length, for deformation intensities measured on 341 pieces of core.


![]()