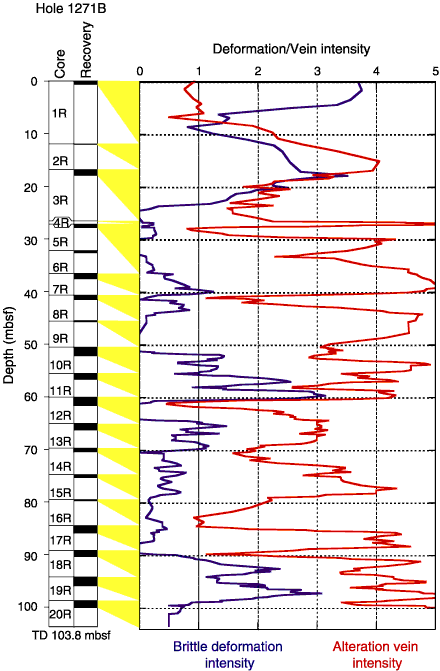
Figure F55. Downhole plot of brittle deformation and alteration vein intensities in Hole 1271B. Expanded depth of cored interval is plotted on the vertical axis. Yellow cones reflect the depth range of expansion for each core. Intensity estimate is based on visual core description of individual core pieces. Intensities are plotted as a running downhole average of seven pieces, weighted by piece length, at each depth (314 pieces total). TD = total depth.


![]()