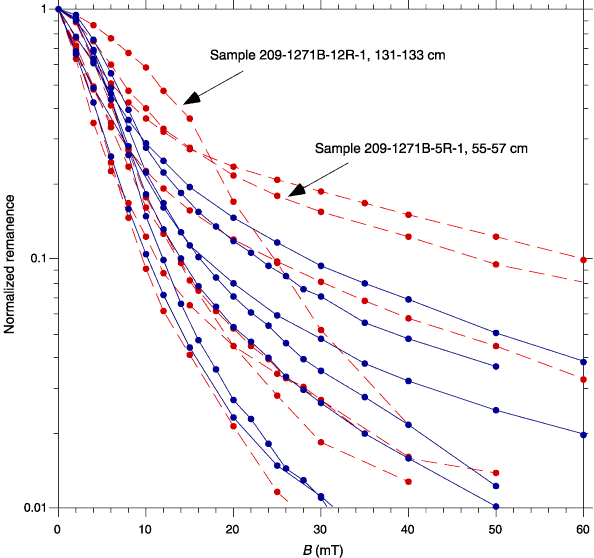
Figure F71. Normalized magnetization decay curves of discrete samples from Site 1271. Decay is plotted as a function of the vector difference sum. Serpentinized samples with no relict igneous structure are shown in blue. Altered dunite, harzburgite, and troctolite are indicated by red dashed curves. Low median destructive fields (3–12 mT) reflect a variable intensity drilling overprint presumably carried by coarse-grained magnetite. B = peak induction.


![]()