Figure F10. Digital and false color images of the distribution of felsic and mafic domains in the quartz-olivine gabbros compared to the rock images. A. A larger portion of the rock that provides a sense of the mafic-rich domains is isolated with a matrix of felsic material (interval 209-1272A-4R-1, 92–111 cm).
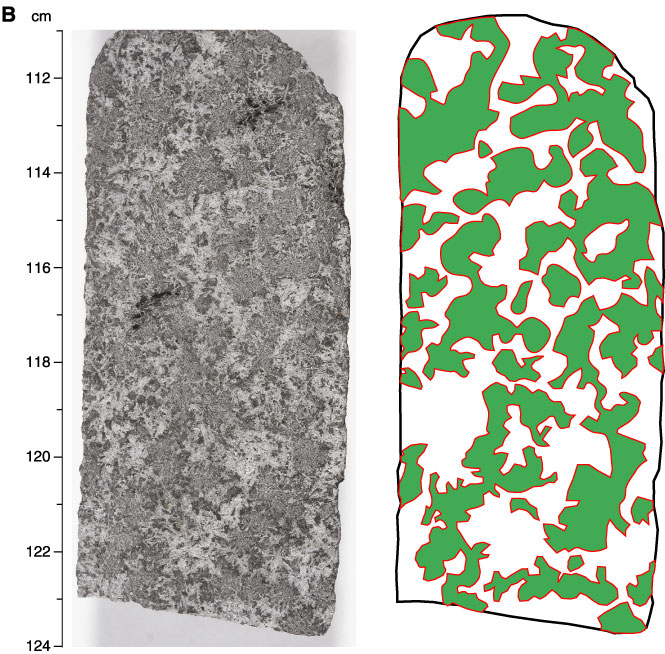
B. A more detailed view, in which it can be seen that the oxide
minerals (darkest in the photo) are preferentially concentrated either within or
at the margins of the felsic domains (interval 209-1272A-4R-1, 111124 cm).