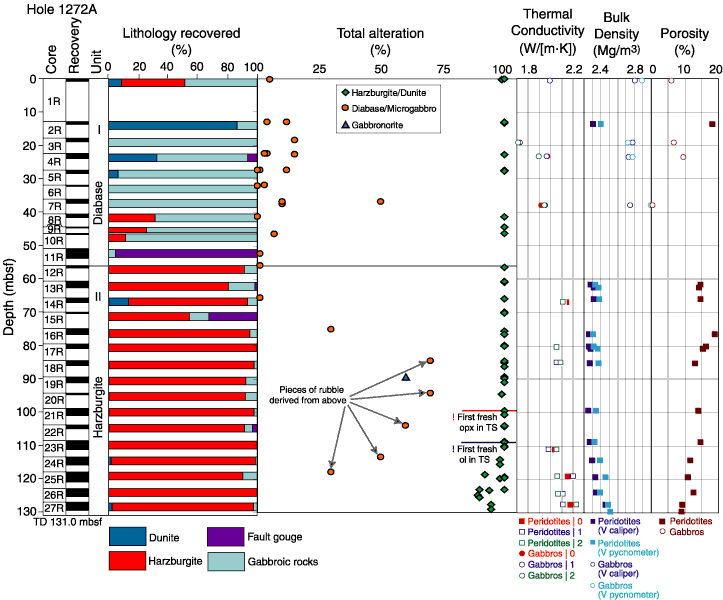
Figure F22. Plot of intensity of alteration vs. depth. Also shown are downhole variations in thermal conductivity, density, and porosity. Note that the decrease in background alteration intensity in the lowermost 20 m of Hole 1272A coincides with increases in thermal conductivity and density and a decrease in porosity. TD = total depth. Opx = orthopyroxene, ol = olivine. TS = thin section.