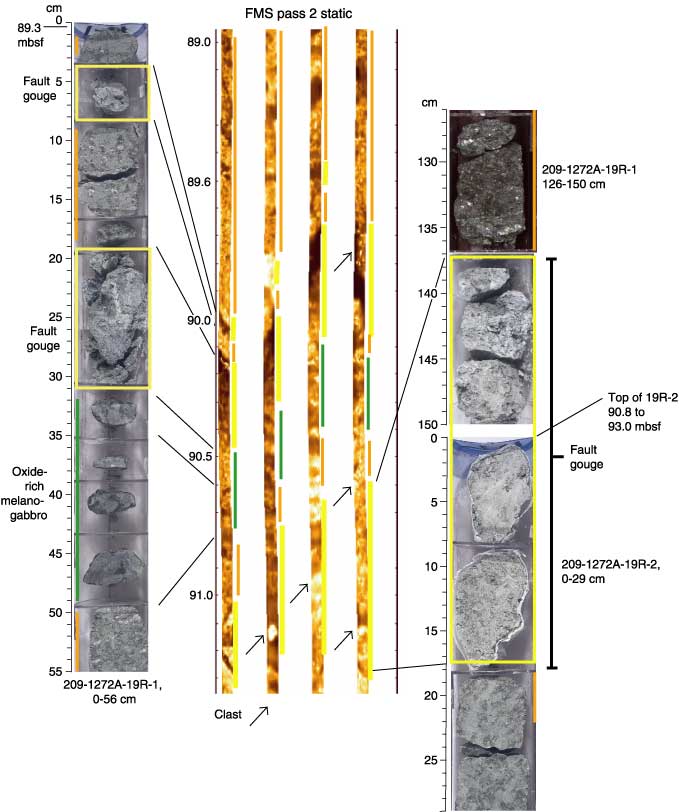
Figure F48. Formation MicroScanner (FMS) static image from logging pass 2 showing interval where two fault gouges and oxide gabbros were recovered along with harzburgites. Two conductive zones are present at the same depth as the first two fault gouges (outlined in yellow and correlated with yellow line in FMS image to denote gouge) in interval 209-1272A-19R-1, 0–56 cm. The banded conductive structure at greater depth may correspond to the presence of oxide gabbros. Gouges (again outlined in yellow) at the base of the same section and the top of the next section (209-1272A-19R-2) appear to be correlated with a conductive zone in the FMS image, interpreted as showing resistive clasts in a conductive matrix. Clasts in the FMS image are indicated with black arrows.