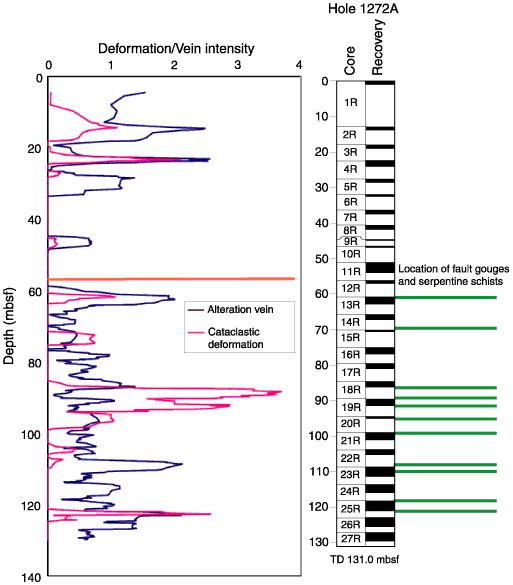
Figure F52. Downhole intensity of shear fractures and alteration vein intensity compared with the location of the fault gouges inferred from FMS images and plotted in Figure F79. Note that most zones of high fracture intensity seem to be correlated with major fault gouge zones. There may also be a correlation between the location of the fault gouge and the intensity of veining. TD = total depth.


![]()