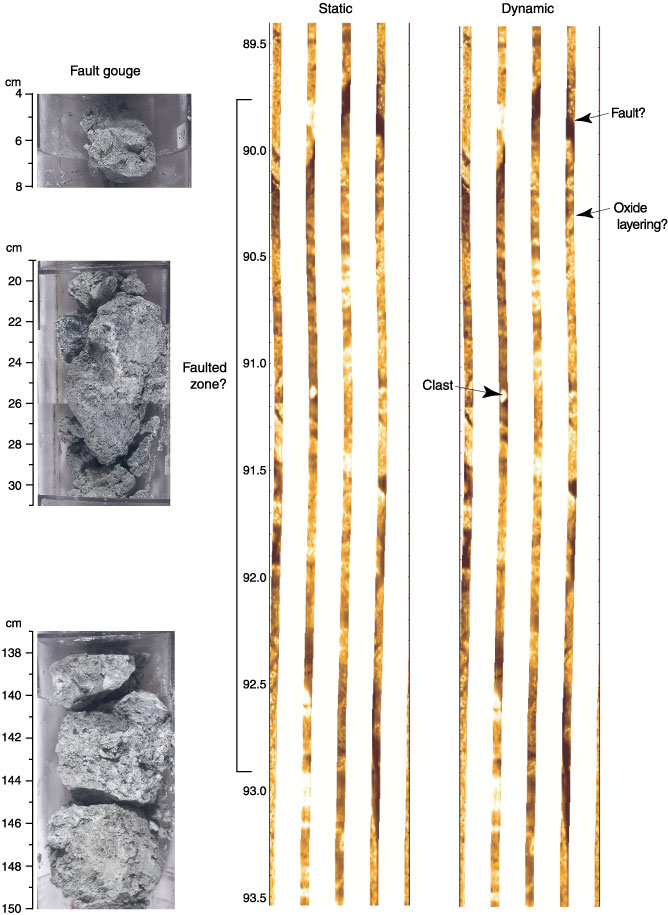
Figure F75.
Static and dynamic FMS images for 89.5-93.5 mbsf showing a potential faulted zone. This zone correlates with fault gouge and oxide gabbro samples recovered from Section 209-1272A-19R-1.