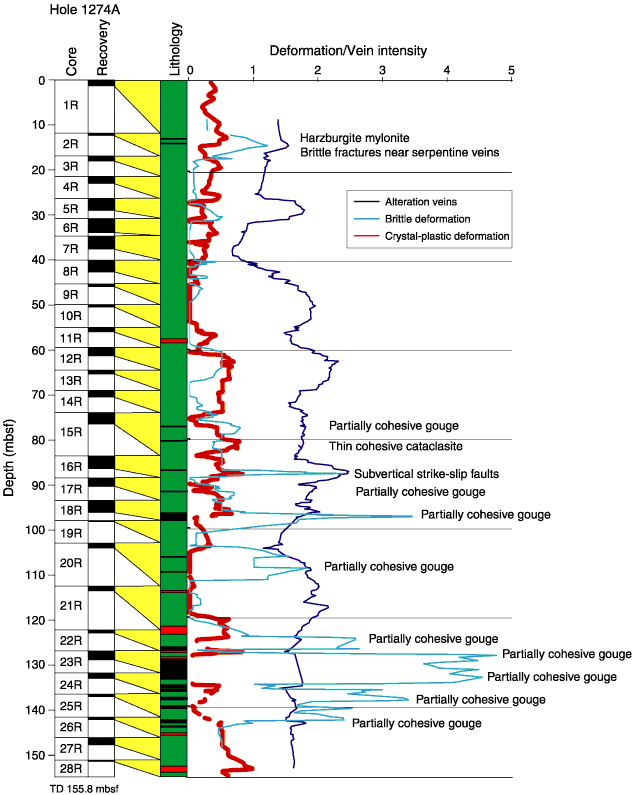
Figure F38. Downhole plot of crystal-plastic deformation, brittle deformation, and alteration vein intensities in Hole 1274A and locations of main deformation features. Expanded depth of cored interval is plotted on the vertical axis. Recovery column: black bars = actual core recovery, yellow cones = depth range of expansion for each core; Lithology column: green = harzburgites and dunites, red = gabbros, black = intervals of gouge material. Intensity estimate is based on visual core description of individual core pieces. Intensities are plotted as a running downhole average of seven pieces weighted by piece length at each depth (468 pieces total). Crystal-plastic deformation intensities were not recorded for the gouge zones. TD = total depth.


![]()